A trading strategy is a clear plan that tells a trader when to enter a position, when to leave it, and how much capital to risk on each trade. It turns random market moves into a set of repeatable actions. Every trading strategy has three core components, the market and timeframe, the entry and exit rules, and the risk management rules
No single trading strategy wins in every market and forever. Success comes from a strategy whose edge is proven with data, whose rules suit the trader’s personality, and whose risk controls keep losses small. Momentum and trend-following strategies have shown long-term profitability when applied with discipline and adjusted to current market conditions. Beginners benefit most from simple, rule-based trading strategies. One common starting point is a moving-average crossover: buy when the short-term average crosses above the long-term average and sell when it crosses below. The rules are visible, easy to test, and quick to follow. Clarity is more useful to the novice than complex trading techniques.
Developing a trading strategy follows a cycle. First, define an objective such as “capture medium-term trends on daily charts.” Next, choose tools (patterns, indicators, or both) to identify those trends. Then write exact entry, exit, and position-size rules. Test the rules on past data. If results show a positive expectancy, forward-test in real time with a small stake. Refine, retest, and repeat. Psychology influences every step when using a trading strategy. Fear can stop a trader from taking valid signals. Greed can push a trader to break exit rules. A sound trading method reduces these impulses, yet the trader must also practice self-control techniques like visualization or breathing drills to follow the plan under stress. Risk management is the safety net of the trading strategy. It limits damage from inevitable losing trades. Common trading tactics include risking no more than one or two percent of account value per trade and placing a stop-loss at a logical price point, such as below recent support in a long trade. By capping loss size, the trader ensures that one mistake never erases months of gains. Markets differ in liquidity, volatility, and session hours. A strategy designed for equities may need faster stops when used on crypto, whose price swings are larger. Futures may demand attention to roll dates. Thus, traders adjust parameters such as timeframe, indicator length, and risk per trade to fit each market’s character while keeping the core logic intact.
In summary, a successful trading strategy is a document of simple, testable, and adaptable rules that direct entries, exits, and position size. It embeds risk controls, respects human psychology, and evolves with the market. Whether the trader is a novice or a veteran, disciplined use of such a strategy is the surest path toward long-term trading success.
What is a Trading Strategy?
A trading strategy is a systematic plan for executing trades in financial markets, using predefined rules to decide when to buy or sell assets. A trading strategy outlines how a trader will achieve profits by going long (buying) or short (selling) under specific conditions. A sound trading strategy is based on objective analysis and criteria, and helps traders make decisions consistently rather than on emotion.
In academic terms, a trading strategy is often described as a fixed plan designed to yield profitable returns by following a set of rules and trading techniques in the market. A trading strategy plan typically specifies the financial instruments to trade, the exact conditions for entering and exiting trades, and how to manage capital and risk. By adhering to well-defined trading tactics, traders aim to impose discipline on their trading process and avoid impulsive decisions, which is a key aspect of understanding the broader trading definition and how it applies in various market scenarios. For example, a simple trading strategy might dictate buying a stock when a short-term moving average crosses above a long-term moving average (a common trend-following signal) and selling when the reverse crossover occurs.
The generation of a trading signal in a trading strategy can be price–based, indicator-based, fundamental-based, sentiment-based, or a hybrid. The logic must be observable and must have a causal or at least statistical link to future price movement. A valid signal is neither vague nor retrospective. A closing price above a moving average is a valid statement. “The market feels strong” is not a valid statement. A complete trading strategy also contains an unambiguous exit rule. The exit can depend on price, time, volatility, or a specific event such as an earnings release. Entry without a predefined exit converts a trading strategy into speculation.
Risk management in a trading strategy defines how much capital to allocate to each trade, what loss is acceptable, and how simultaneous positions interact. A beginner may use a fixed percentage of capital per trade. An advanced practitioner may apply value-at-risk, conditional value-at-risk, or a convex position-sizing curve to limit tail exposure. Risk management rules turn a potentially profitable idea into a sustainable process by controlling drawdown and protecting against ruin.
A robust trading strategy retains profitability under small changes in parameters and under realistic transaction costs. Robustness is verified through out-of-sample testing, walk-forward analysis, and Monte Carlo resampling of trade sequences. A robust strategy shows a stable equity curve and a moderate maximum drawdown relative to its expected return. A scalable trading strategy can accept more capital without widening the bid–ask spread or exhausting available liquidity. Scalability is vital for institutional traders, less critical for retail traders.
Markets evolve, and structural breaks occur. An adaptable trading strategy incorporates regime detection or periodic retraining. Machine-learning-based strategies retrain on rolling windows. Rule-based strategies may switch between sub-models when volatility or correlation crosses a threshold. Adaptability prevents deterioration of the edge when the underlying assumptions change.
Trading strategies range from very simple (e.g., “buy on price dips of 5%”) to extremely complex algorithmic systems, but all share the goal of making trading decisions methodical and repeatable. In practice, trading strategies are rooted in technical analysis, fundamental analysis, or a combination of both, but at their core, they translate market observations into a concrete action plan for trades.
A trading strategy consists of three main components. These are the market and timeframe, the entry and exit rules, and the money or risk management rules. Together, these components ensure the strategy is comprehensive and covers what to trade, when to trade, and how to protect capital.
First, the strategy must specify the market or assets to trade and the timeframe, for instance, if it will focus on stocks, forex, or cryptocurrencies, and on daily charts or intraday. Second, it establishes precise entry and exit rules, which are the conditions under which trades will be opened or closed. These rules might be based on indicators (e.g., “buy when the RSI < 30” for oversold conditions) or patterns (e.g., “sell after a head-and-shoulders pattern completes”). Third, a strategy includes money management or risk management rules, detailing position sizing and how to limit losses (e.g., stop-loss levels). Additional components often enhance a trading strategy’s effectiveness, especially when tailored to specific goals and preferences, which can vary significantly depending on the types of trading a trader chooses to pursue. Many strategies start with clear trading goals and style. For example, a goal might be a 15% annual return, and the chosen style could be swing trading to suit a trader who cannot monitor markets all day.
Risk management parameters are fundamental. A trading strategy should define the maximum percentage of capital risked per trade or per day, ensuring that no single loss can be catastrophic. Position sizing techniques (how large each trade will be relative to the account) fall under the risk management category. Strategies also usually articulate entry signals (what technical/fundamental triggers justify opening a position) and exit signals for both winning trades (profit targets or trailing stops) and losing trades (stop-loss orders). For example, a component might be: “Enter long when price closes above the 50-day moving average, exit when price falls back below it, and set a stop-loss 5% below entry.”
Documentation and review are components sometimes included in a trading strategy plan. Robust documentation should extend beyond the basic trade log to include the thesis behind each position, contemporaneous market conditions, and any discretionary overrides, in order to enable later attribution analysis and machine‑learning feature engineering.

Momentum and trend strategies are widely regarded as among the most successful historically. However, there is no single most successful trading strategy universally, because performance depends on market conditions and the trader’s execution. Different strategies excel in different environments. For example, trend-following strategies have historically performed well by capturing large moves in markets, whereas mean-reversion strategies profit from range-bound conditions.
Academic research indicates that momentum/trend strategies are among the most robust over time. In equities, a simple momentum approach of buying past winners and selling losers has yielded abnormal returns in many studies, for example a study by Jegadeesh Titman, titled “Returns to Buying Winners and Selling Losers: Implications for Stock Market Efficiency”.
Long-term trend-following across asset classes has shown remarkably consistent profits over decades. The 2017 study “A Century of Evidence on Trend-Following Investing” by Hurst, Ooi, and Pedersen found that a century-old trend-following strategy produced strong returns through various crises, with low correlation to stock and bond markets. This suggests that strategies exploiting persistent market biases, like momentum, can be very successful.
Some of the most successful trading entities, such as Renaissance Technologies’ Medallion Fund, use a combination of quantitative strategies. Medallion’s proprietary algorithms have famously achieved about 66% average annual returns (gross) since 1988 by combining numerous high-frequency and statistical arbitrage strategies. This illustrates that a multi-strategy quantitative approach can be extraordinarily successful in practice.
No trading strategy guarantees perpetual success, and often the “best” strategy is one that aligns with the trader’s skills and risk tolerance. A contrarian view grounded in the Efficient Market Hypothesis argues that no strategy should consistently outperform the market without taking extra risk, as markets are generally competitive and information-rich. This view implies that periods of outperformance for any given strategy may be due to luck or specific market regimes rather than a permanent edge. Many legendary traders stress that discipline and adaptability are more important than chasing any single holy grail strategy. As market wizard Bruce Kovner put it, “There are a million ways to make money in the markets. The irony is that they are all very difficult to find.” The most successful trading strategies are often those that a trader can execute consistently, which is a defining characteristic of many of the best trading strategies that have stood the test of time across different market conditions. For some, that might be a systematic trend-following model that rides major trends (with research backing its long-term efficacy), while for others it could be a value investing approach in equities or a volatility arbitrage strategy in options. Many experts diversify across multiple strategies, for example, combining trend and mean-reversion, to smooth out performance.
How important are trading strategies for becoming a successful trader?
Trading strategies are extremely important for becoming a successful trader. They provide the roadmap for decision-making, enforce risk control, and help manage psychological biases by pre-defining actions. Without a strategy, even a talented trader is prone to inconsistent results and avoidable large losses. With a solid strategy, even a modest edge can be leveraged into long-term success through consistent application and refinement.
Having a well-defined trading strategy is critically important for trading success. It is often said that trading without a strategy is like driving blindfolded. A strategy imposes structure, discipline, and consistency on a trader’s actions, which are essential qualities in the unpredictable environment of financial markets. Without a strategy, trading decisions tend to be driven by impulse or emotion, making outcomes erratic.
Experts frequently compare trading without a plan to gambling, because without rules, a trader is just relying on luck. Empirical evidence and trader surveys indicate that the majority of independent traders lose money, often because they lack a coherent strategy and risk management rules to guide them. Traders who approach markets with a trading strategy and a concrete plan can measure performance, refine their methods, and avoid instinctive reactions. A defined strategy is the foundation of consistency, and turns trading into a repeatable process rather than a series of one-off bets.
All of the world’s top traders and funds emphasize the importance of sticking to a strategy or system. For instance, Paul Tudor Jones famously said, “The most important rule of trading is to play great defense, not great offense.” This highlights that having a plan (defense) to manage risk is more vital than clever trade ideas. A trading strategy and in particular trading strategies for beginners encapsulate that defensive plan by specifying what to do in adverse situations (like predefined stop-loss points).
Trading for beginners should be entirely focused on understanding and building a trading strategy. Successful traders attribute a large portion of their success to discipline, which effectively means discipline in following a trading strategy. A study of Brazilian futures traders found that those who traded according to a plan had significantly higher survival rates than those who traded arbitrarily (dos Santos et al., 2019). This aligns with the idea that strategy is not optional but a prerequisite for longevity. Beginner traders are advised to never place a trade without a trading strategy (as one risk management maxim goes, “Plan the trade and trade the plan.”) By having a strategy and adhering to it, a trader can evaluate what works and what doesn’t, creating a feedback loop for improvement, an essential part of the journey for anyone looking to become a trader with long-term potential. Conversely, a trader who changes tactics on a whim or chases tips has no baseline to learn from and is likely to repeat mistakes.

The best trading strategy for beginners is typically one that is simple, clear, and focuses on learning the proper process over quick profits. Novice traders benefit from strategies that are easy to understand and execute, allowing them to build confidence and discipline. Beginner traders should start with basic trend-following or momentum strategies that align with broader market movements, rather than very complex or high-frequency techniques.
For example, a beginner might use a strategy of buying strong companies (or an index fund) on dips and holding for several weeks (a basic swing trading strategy), or a straightforward moving average crossover system to identify the trend. The key is that the strategy should have few moving parts and clear rules, so the new trader can follow it without confusion.
Beginner trading strategies use the simplest indicators and approaches. It’s best to start with the basics before attempting advanced techniques. This might mean relying on one or two technical indicators or price patterns at most. For instance, a beginner-friendly strategy could be: “Trade in the direction of the 50-day moving average trend. Buy when price rebounds from a support level and is above the 50-day MA, use a stop-loss below support, and aim for a moderate profit target.” Such a strategy is relatively easy to follow and teaches the beginner how to identify trends, support/resistance, and risk management.
The best trading strategies for beginner traders always emphasizes risk management and skill-building. Instead of chasing high returns, a novice’s strategy should teach traders how to protect their capital and make decisions systematically. A commonly cited tip is to “keep it simple and trade with the trend”, since trading in the direction of the prevailing trend can be more forgiving for newcomers.
Beginner traders are always advised to incorporate stop-loss orders and modest position sizes into their trading strategy to limit losses, for example, risking no more than 1% or 2% of their account on any trade. A good beginner trading strategy might involve longer time frames (like daily charts) rather than very short-term 5-minute charts, because longer-term moves are easier to grasp and less noisy. For instance, a simple beginner strategy could be buy-and-hold for a slightly longer term.
While buy-and-hold is more of an investing approach, it is arguably the safest “strategy” for an absolute beginner to get their feet wet, as even Warren Buffett suggests newcomers consider broad index funds. On the active trading side, paper trading (simulated trading) strategies is highly recommended for beginners to practice without real risk.

Trading strategies such as trend and support/resistance, based on simple, timeless concepts, are the easiest to learn. They require only basic chart-reading skills and a few rules. As traders gain experience with these straightforward methods, they often develop a deeper understanding that can later be applied to more complex strategies. Simplicity often outperforms overly complex approaches. The easiest strategies avoid the need for complex calculations or large numbers of indicators. They often rely on one core signal.
The easiest trading strategy to learn is typically one that has minimal rules and relies on intuitive, visual setups. Many traders and educators point to basic price action strategies, such as trading based on support and resistance levels or simple chart patterns, as among the easiest for beginners or anyone to grasp. These straightforward methods can serve as a strong foundation for those beginning to learn trading and develop their market instincts.
One of the simplest and most effective strategies in the world is simply trading price action signals from horizontal levels on a chart. This approach involves identifying key support or resistance levels and then watching for a clear candlestick pattern (like a pin bar or engulfing candle) at those levels to signal a trade. It’s easy to learn because it doesn’t require understanding complex indicators, and a trader only needs to recognize a few recurrent patterns and important price levels. Such strategies align with the adage “keep it simple” in trading. If price shows a clear reversal signal at a major support, you buy; if it shows a bearish pattern at resistance, you sell. The rules can be explained in a few sentences and observed directly on a chart, making it very accessible.
The basic moving average crossover system is a famous trading strategy considered to be one of the easiest to learn. For instance, using a 50-day and 200-day moving average, buy when the 50-day crosses above the 200-day (the “golden cross”) and sell when it crosses below (the “death cross”). This strategy is simple because it reduces the decision to a single observable event, the crossing of two lines on a chart. While it may not catch every nuance, it gives beginners a straightforward rule to follow that historically has captured big trend changes in markets. Though not active trading, buy-and-hold investing can be considered the simplest strategy, essentially purchasing a diversified asset (like an index fund) and holding it regardless of short-term fluctuations. It’s conceptually easy and often successful over long periods, which is why new traders are sometimes advised to start as investors and gradually shorten their trading horizon as they gain knowledge. Within active trading, candlestick pattern strategies like buying after a “hammer” candlestick (which indicates a potential bullish reversal) or selling after a “shooting star” candlestick, can be easy to learn. Each of these classic one or two-candle patterns has a clear visual definition, and beginners can train themselves to spot them without much complexity.
The hardest trading strategies are either highly technologically complex, like High-Frequency Trading (HFT) and algorithmic arbitrage, or extremely demanding in terms of knowledge and psychological fortitude, like global macro discretionary trading, options trading and aggressive scalping.
HFT strategies rely on powerful computer algorithms to trade in fractions of a second, exploiting tiny price discrepancies or order flow patterns. These strategies are hard because they require deep quantitative expertise to design algorithms, and they demand expensive technology infrastructure (co-located servers, direct exchange connections, etc.) for execution at lightning speeds. HFT is dominated by well-capitalized firms and is beyond the reach of individual traders, which makes it one of the most complex forms of trading. The intricacies of managing HFT strategies, including handling massive data, optimizing algorithms to be faster than competitors, and controlling execution costs, render them among the hardest to execute effectively.
Global macro discretionary trading is when a trader attempts to predict moves across currencies, commodities, bonds, and equities based on macroeconomic themes. Discretionary trading is hard because it requires an encyclopedic knowledge of economics, politics, and central bank actions, as well as the ability to synthesize disparate information into a trade thesis. Macro traders often note the challenge of timing and sizing such trades correctly. One must be right on both the idea and the timing, which is a high bar. Options trading strategies that involve complex spreads and volatility forecasting are among the hardest trading strategies. Strategies like delta-neutral trading with continuous re-hedging, or intricate volatility arbitrage, require advanced mathematical understanding (e.g., of option Greeks) and constant adjustment. Options trading strategies can be conceptually and logistically demanding. Options traders must monitor multiple positions and sensitivities simultaneously and respond quickly to market changes. Scalping strategies (rapid in-and-out trading for very small profits many times a day) are considered very difficult for most individuals. Scalping requires intense focus, extremely quick decision-making, and discipline to cut losses instantly. The profit per trade is so small that any mistake or hesitation can wipe out dozens of successful scalps. The margin for error in scalping is razor thin, and this makes scalping one of the hardest styles to master, psychologically and technically. Any strategy that is overly complex with many rules or parameters can be hard to implement. For instance, a strategy that uses ten different technical indicators in a decision algorithm may be “hard” in the sense that it’s easy to get analysis paralysis or to overfit the model to past data, leading to confusion in live trading. Complexity in strategy often introduces more potential points of failure and requires greater expertise to manage.
Some of the hardest strategies in practice are those that demand exceptional discipline. Martingale strategies (doubling down on losses) are mathematically dangerous and require a very high risk tolerance (and a large bankroll). Executing such a strategy without succumbing to fear is extremely hard, and indeed this approach is generally discouraged by professionals because of its risk. Discretionary contrarian trading (picking tops and bottoms against the crowd) is challenging because it pits a trader’s judgment against prevailing market momentum. It requires excellent timing and conviction, and the psychological difficulty of going against the herd is high.
What are the Best Trading Strategy Tips?
Successful trading is not just about the strategy itself, but also about how you execute and manage that strategy. Over the years, experienced traders and institutions have compiled a number of key tips that consistently prove beneficial.
Below are some of the best trading strategy tips, distilled from expert advice and trader interviews.
- Always Have a Plan and Stick to It: Every trade should be guided by a well-considered plan, including entry, exit, and risk parameters, defined before the trade is placed. Sticking to your trading strategy and rules is crucial. This means avoiding impulsive deviations: if your strategy says to exit at a certain stop-loss, do so without hesitation. A clear plan helps remove emotion from the equation.
- Prioritize Risk Management: Successful traders universally emphasize risk control. As Paul Tudor Jones famously said, “Don’t focus on making money; focus on protecting what you have.” Set a stop-loss for every trade and size positions such that even a string of losses won’t jeopardize your account. A good rule of thumb is to risk only a small percentage (e.g., 1-2%) of capital per trade to survive losing streaks. Ensuring that potential loss is limited is more important than chasing big gains.
- Use a Favorable Risk/Reward Ratio: Only take trades where the potential reward significantly exceeds the risk. For example, aim for trades where you could make at least 2x or 3x what you’re risking. By being selective and choosing high risk/reward opportunities, you increase the likelihood that gains will outweigh losses over time. This prevents taking lots of small-profit trades that can be wiped out by one loss.
- Be Disciplined and Consistent: Discipline is the backbone of trading success, it means following your rules under all market conditions and not yielding to greed or fear. Consistency in approach leads to more stable results and the ability to evaluate your strategy fairly. Many top traders stress that discipline to follow the system was a major part of their success. If you have a written trading plan, commit to executing it trade after trade. Over time, this consistency will allow the probabilities to play out in your favor.
- Keep a Trading Journal and Review Your Performance: Meticulously record each trade (entry, exit, reasoning, outcome). Over time, this journal becomes gold for learning. Regularly reviewing your trades can highlight mistakes, strengths, and patterns in your performance. Perhaps you’ll notice that trades taken on impulse (outside your strategy) lost money, reinforcing why you should avoid them. Or you might find your strategy works better in trending markets than choppy ones, prompting you to filter trades by market condition. Self-review is how traders refine trading strategies and improve.
- Stay Educated and Adaptable: Markets are dynamic, so continuous learning is important. Follow economic news, new trading research, and be ready to adapt your strategy if market conditions fundamentally change. For example, if volatility spikes or a market regime shifts from bullish to range-bound, you might need to adjust your approach. Adaptation should be systematic. Avoid random strategy-hopping. Instead, incorporate new knowledge through careful testing. Being open to learning (from books, courses, or experienced peers) helps a trader evolve and maintain an edge.
- Manage Emotions: Emotional control is vital. Do not let fear or greed dictate your trades. One tip is to use your strategy’s rules to decide actions in advance, so you’re not making choices in the heat of the moment when emotions run high. If you feel particularly emotional (angry after a loss or overconfident after a win), it’s often best to step away briefly. Techniques like deep breathing, sticking to a routine, or even algorithmic trading can help minimize emotional interference.
- Use Stop-Losses and Take Profits: Always set a stop-loss when you enter a trade. This predefined exit prevents small losses from growing into account-threatening ones. Similarly, consider having profit targets or trailing stops to lock in gains. By planning exits on both sides, you avoid the common pitfalls of “letting losers run” or “cutting winners too early” due to emotional reactions.
- Adjust to Market Conditions: While the core strategy might remain the same, savvy traders adjust parameters (like position size or aggressiveness) based on market volatility. For example, in extremely volatile markets, you might trade smaller sizes or use wider stops. In quiet markets, you might be more selective with only high-confidence setups. The tip is to be aware of the environment (bullish, bearish, volatile, calm) and fine-tune your approach accordingly.
- Don’t Overtrade: Quality over quantity is key. Taking too many trades, especially when conditions aren’t favorable, can erode gains through commissions and errors. Be patient and only trade when your strategy gives a clear signal. Avoid forcing trades out of boredom or a desire to “make something happen.” Overtrading often stems from emotional impulses rather than solid opportunities. Sticking to your strategy’s signals and sitting out when there are none is a discipline that preserves capital.
These tips revolve around planning, risk control, and maintaining the right mindset. Real-world trading success comes from doing a lot of small things right consistently, not just from one big winning trade. By following these best practices, like keeping losses small, having a plan, and continuously learning, a trader can greatly enhance the effectiveness of any trading strategy they employ.

How to Develop a Trading Strategy?
Developing a trading strategy involves a step-by-step process of research, planning, testing, and refinement. It’s akin to the scientific method: you form a hypothesis about a market inefficiency or trading idea, test it on data, and iterate. Below is a structured approach to developing your own trading strategy:
- Define Your Objectives and Constraints: Start by clarifying what you want to achieve with your trading and what resources or limits you have. Determine your financial goals (e.g., a target annual return or income), risk tolerance, time commitment, and the markets/instruments you’ll focus on. For example, a working professional might decide on a swing trading strategy on equities, aiming for moderate growth, whereas a full-time trader might target intraday forex trades. Ensure your strategy fits you, your capital, schedule, and risk comfort.
- Choose a Trading Style and Timeframe: Based on your objectives, select the style (day trading, swing trading, position trading, etc.) and timeframe that suits you. If you can only trade in the evenings, perhaps end-of-day swing trading on daily charts is appropriate. If you enjoy fast-paced action and can monitor markets constantly, day trading 5-minute charts could be viable. The style will influence the kind of strategy you develop. Day trading strategies might revolve around intraday volatility and news, while swing strategies lean on technical patterns over days.
- Develop or Identify Your Edge/Strategy Idea: Formulate the rules of your strategy. Decide on what will trigger your entries and exits. You might base this on technical analysis (e.g., indicators or chart patterns) or fundamental analysis (e.g., trading around earnings reports or economic data), or a combination. For instance, you might notice that a particular stock index tends to rebound when a certain sentiment indicator is extremely low. That observation can become a strategy rule: “Buy when sentiment X drops below Y and price shows a stabilization pattern.” Ensure your strategy includes entry criteria, exit criteria (for both wins and losses), and position sizing rules. It’s helpful to keep the initial version of the strategy relatively simple, as this is easier to test and refine.
- Formulate the Strategy Details: Explicitly write down the strategy in detail. The strategy should be unambiguous. Another person reading it should interpret the rules the same way you do. This explicit formulation is critical because it allows for objective testing. For example: “Trade EUR/USD on 1-hour chart. Entry: When 1-hour RSI < 30 (oversold) and price prints a bullish engulfing candle, go long. Exit: Take profit at the 50-period moving average or if RSI > 50, whichever comes first; stop-loss below the recent swing low. Position size: 2% of account equity risked per trade.”
- Backtest the Strategy on Historical Data: Using past market data, apply your strategy rules to see how it would have performed. This can be done manually (scrolling through charts bar by bar) or using software that automates backtesting. Backtesting reveals whether your idea has merit. Pay attention to metrics like win rate, profit factor, and maximum drawdown. A strong historical performance (beyond random chance) indicates a potential edge. For example, you might find that your strategy had a 55% win rate and made 1.5 units of profit for every 1 unit of loss over 5 years, and that could be promising. It’s important to use enough data and diverse market conditions in backtesting to avoid overfitting (making a strategy that only worked in one period). Tools like MetaTrader, TradingView, or Python backtesting libraries can assist in this process. As you backtest, you might discover tweaks that improve the strategy (e.g., maybe adding a trend filter like “only trade longs when above the 200-day MA” improves results). Make adjustments cautiously and test again.
- Evaluate and Optimize: Analyze the backtesting results. Identify any weaknesses. For instance, perhaps the strategy does poorly in sideways markets or has an unacceptably large drawdown at some point. You can try optimizing parameters (such as adjusting an indicator period or stop-loss distance) to see if performance improves, but be wary of over-optimization (curve fitting). The goal is to find a robust set of rules that aren’t overly tuned to past noise. Robustness is validated by out-of-sample testing. You could split your historical data, backtest on one portion, then verify the strategy on the unused portion to see if it still holds up. At this stage, you may iterate, which means going back to strategy formulation and adjust rules or add/remove conditions, then backtest again. Industry practice suggests following a systematic approach. The eight-step strategy development life-cycle is (1) Formulation, (2) Specification in a testable form, (3) Preliminary backtesting, (4) Optimization, (5) Performance evaluation (risk/reward metrics), (6) Live trading (small scale), (7) Performance monitoring, (8) Refinement. The key is that after a few iterations, you have a strategy that historically performs well and makes logical sense.
- Forward Test with Paper Trading: Before risking real money, trial the strategy in real-time market conditions using a demo account or paper trading. The forward testing stage is crucial to see if the strategy works in the current market and if you can execute it correctly. Sometimes a strategy that looked great on historical data might encounter slippage or behave differently in a live environment. Forward testing lets you observe that without financial risk. During this phase, also assess practical factors. Are the signals too frequent or too infrequent for your taste? Can you realistically take all the trades (given your day job or other constraints)? Is the execution achievable (for example, a strategy that requires entering 10 orders in a second is not practical for a human)? This step often reveals any execution issues and ensures the strategy is workable in real life.
- Implement with Real Capital Gradually: If the paper trading results are positive and align with backtesting, you can start trading the strategy with real money, usually at a small scale initially. Start with a small position size to make sure everything goes as expected. Sometimes emotions or unforeseen issues arise when real money is on the line, even if the strategy is sound. By starting small, you can acclimate and resolve any last-mile problems (like broker execution differences or psychological hesitation) without large losses. Treat this as a pilot test of the strategy in live conditions.
- Monitor Performance and Keep Records: As you trade the strategy, track its performance metrics and compare them to the backtest expectations. Normal variation will occur, but if something significantly diverges (e.g., a much lower win rate than expected), investigate why. It could be due to a changing market regime or perhaps an error in execution. Keep a detailed log of trades (date, instrument, entry, exit, outcome, notes). Monitoring in this way helps ensure the strategy is delivering as intended and allows for accountability (are losses coming from the strategy or from deviating from it?)
- Refine and Evolve the Strategy: Trading strategy development is an ongoing process. Use the data from live trading to fine-tune. Maybe you discover that adding a time filter (avoiding late Friday trades, for example) could improve outcomes, or that a certain currency pair doesn’t work well with your strategy while others do exceptionally well. Implement small adjustments and see if they enhance performance, always testing changes (preferably by backtesting and paper testing again). Stay alert to market changes. Ff market volatility doubles from when you first developed the strategy, you might need to adapt stop-loss distances or risk per trade. Continuing education and periodic strategy review are vital. Markets evolve, and a good trader evolves their strategies accordingly. However, maintain balance. Avoid jumping ship at the first sign of a losing streak (all strategies have them), but do make data-driven adjustments when there is sufficient evidence.

Trading psychology has a profound impact on whether a trading strategy ultimately succeeds or fails. Even a strategy with a statistical edge can be undermined if the trader cannot execute it faithfully due to psychological pressures. Key psychological factors include emotions, like fear and greed, cognitive biases, and discipline. Fear might cause a trader to exit trades too early or avoid taking valid signals, while greed or overconfidence might lead to overtrading or taking on excessive risk.
Bad psychological behaviors in applying a tradings strategy deviate from the strategy’s rules and can significantly hurt performance. Research in behavioral finance shows that traders are not purely rational and are often influenced by biases and emotional reactions, which leads to suboptimal decisions.
A classic example of how psychology impact trading strategies is the loss aversion bias. This is the tendency to feel the pain of losses more than the pleasure of gains, which can cause traders to hold losing positions longer than they should (hoping to avoid realizing a loss) and cut winners early (to “secure” the gain). Loss aversion bias is the opposite of the old trading adage “cut your losses short, let your profits run,” and it wreaks havoc on strategy outcomes. If a strategy calls for a 1:3 risk-to-reward ratio but the trader’s loss aversion makes them consistently exit when a trade is just breaking even (instead of letting winners run) or hesitate to stop out of losers, the whole expectancy of the strategy is ruined.
Discipline and emotional control are integral to realizing a strategy’s potential. A disciplined trader follows the strategy’s rules even when it’s psychologically uncomfortable, for example, taking a loss according to plan without second-guessing or entering a trade on a signal even after a few prior losses (trusting the probabilities). Many experts argue that trading is largely a mental game. Trading is 80% psychology and 20% methodology,” as the saying goes. Two traders with the same strategy can have vastly different results, depending on their mindset. A trader who becomes anxious after a drawdown might start deviating from the strategy, maybe skipping the next trade, which turns out to be a big winner, whereas a psychologically steady trader will continue to execute the plan and thereby catch that winner. Studies of day traders have found that emotional reactions to prior trades (like becoming overly risk-averse after a loss or overconfident after a big win) often lead to performance degradation. Traders start “trading their P&L” rather than the market. This underscores how crucial it is to maintain consistency and not let recent outcomes emotionally hijack you, and highlights the central role of trading psychology in sustaining long-term performance.
Confirmation bias might lead a trader to give extra weight to information that confirms their existing view and ignore information that contradicts it. In a trading strategy context, this could mean a discretionary trader sees a valid entry signal but “feels” uneasy due to some news, and rationalizes skipping the trade by selectively focusing on negative information, potentially missing a good trade. Overconfidence bias might cause a trader to increase position sizes beyond strategy recommendations after a streak of wins, assuming they can’t lose, only to hit a normal losing streak and suffer outsized damage. Impulse control means not trading when there are no valid signals, which many find hard (the urge to do something is strong). Impatient traders may jump into subpar setups out of boredom or FOMO (fear of missing out), which violates the strategy and usually hurts results.
Traders who masters their psychology can exploit their strategy to its fullest. Good trading psychology involves self-awareness, or knowing your tendencies and pitfalls. For example, if you know you tend to panic-sell, you might incorporate safeguards like automated stops or even algorithms to execute exits so you don’t second-guess. Psychological resilience is key. Strategies go through losing periods, and a trader with confidence in their system and emotional fortitude will stick with it, whereas a shaken trader might abandon a good strategy at the worst time. A famous illustration is the Turtle Traders experiment in the 1980s. A group of novices was taught a simple trend-following strategy. Those who adhered to the rules made big profits, but some failed because they lost faith during drawdowns or deviated due to nerves, showing that psychology, not the strategy rules themselves, was the differentiator in performance.

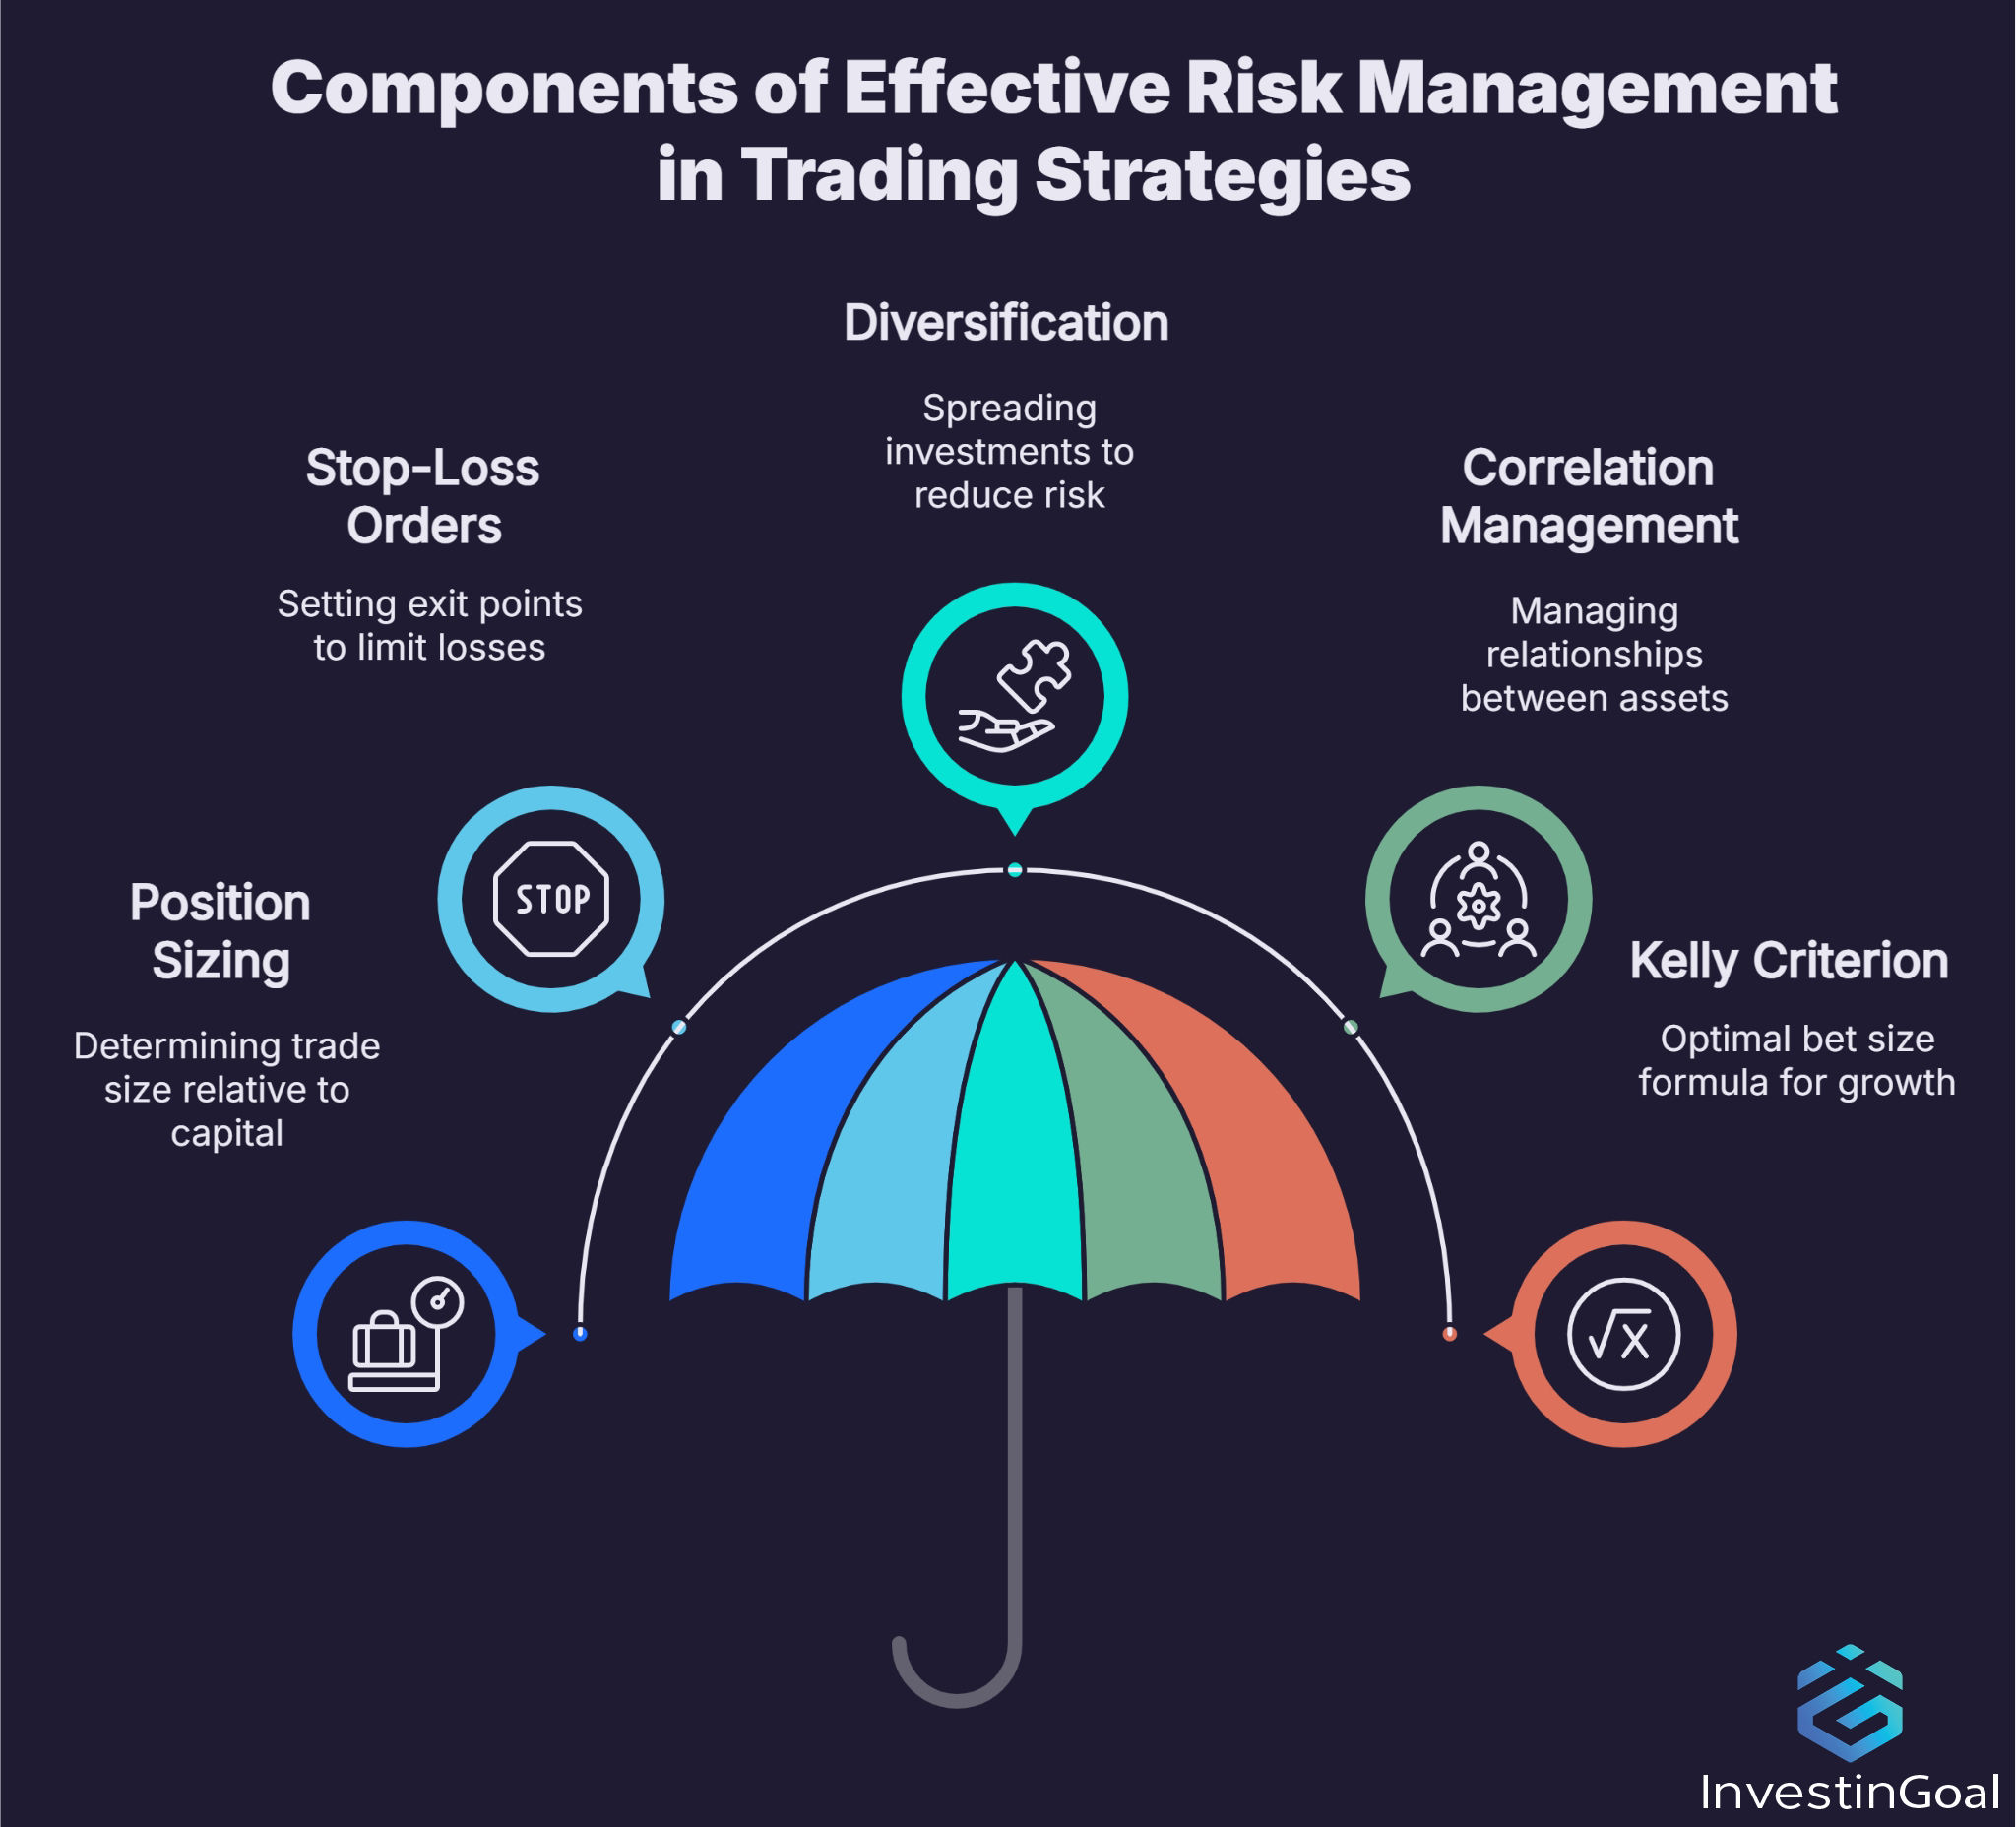
Risk management is fundamental to any trading strategy’s success and longevity. Key aspects of risk management include position sizing, stop-loss placement, and overall portfolio risk control. A sound risk management approach ensures that losses are kept small enough that the trader survives to capitalize on the strategy’s edge over time. Risk management is the only thing traders can control in trading, since market outcomes are uncertain.
Risk management in a trading strategy transforms a theoretical edge into real-world, sustainable profits by controlling the downside. New traders focus wrongly on how much they can make, while experienced traders focus on how much they could lose. The fundamental practices for risk management in a trading strategy include using stops, sizing positions wisely, diversifying, and continuously respecting the potential for loss.
Position sizing in a trading strategy means deciding how large a trade to take relative to your capital. Strategies often specify this as a percentage of account equity (for example, risking 1% of the account on each trade). This ensures that no single trade can blow up the account, and even a series of losses will only draw down a manageable portion. Without position sizing rules, a trader could bet too much on a single trade, and a single unfavourable move could have severe consequences on their capital. History is replete with examples (from individual day traders to hedge funds like Long Term Capital Management) where insufficient risk controls led to huge losses despite prior success. Stop-loss orders are predetermined exit points to cut a losing trade. By placing a stop, a trader defines the maximum loss on that trade in advance. Using stop loss orders in a trading strategy prevents the dangerous scenario of a small loss turning into a huge one because the trader freezes or hopes for a rebound.
Following is an example of implementing risk management. If your strategy indicates a trade, you calculate position size such that (Entry Price – Stop Price) * Position Size = acceptable loss amount. For example, if your account is $10,000 and you risk 1% per trade ($100), and your trade setup has a stop 5 points away from entry, you take 20 shares/contracts (since 5 * 20 = 100). This way, even if the trade fails, you only lose $100.
Risk management in a trading strategy prevents large drawdowns, which is crucial because of the mathematics of recovery. A 50% loss requires a 100% gain to recover, so avoiding big losses is far more important than hitting big wins. With strong risk management, a strategy can endure a string of losses that inevitably will occur in random distribution, and still come out profitable when the winners (that the edge provides) arrive. Without it, even a strategy with an edge might face a ruinous loss before its edge manifests.
Diversification and correlation play a strategic role in risk management. If a trading strategy or trader runs multiple trades or strategies, managing risk involves not just single-trade risk but total exposure. For instance, if all your trades are highly correlated (say you are long five tech stocks), you might limit how much combined exposure you have to that sector or factor, because a single adverse event could hit all simultaneously. A risk-managed strategy might include rules like “no more than 15% of account in any one stock” or “no more than 5 open positions at a time” to prevent piling on too much risk. Hedge funds often use “value at risk” (VAR) or stress test scenarios to ensure that even in worst-case events (say a 1987-style crash or a sudden market gap) the portfolio would survive. The principle is know the worst-case and protect against it.
A well-known concept in risk management is the Kelly Criterion (an optimal bet size formula). In theory, a trading strategy that follows Kelly sizing will maximize long-run growth of capital. However, Kelly can lead to very aggressive sizing, so many traders use fractional Kelly or simpler fixed-percentage risk to avoid wild swings. The Kelly criterion implies that any positive-edge strategy will eventually grow capital if you avoid betting too large, and that there is an optimal level of risk, below it, you grow slower, above it, you dramatically increase the risk of ruin. Most traders err on the side of caution, risking much less than the theoretical optimum, which is sensible to accommodate psychological comfort and model uncertainty.
The purpose of chart patterns in trading strategies is to help traders identify probabilistic setups for future price movement based on recurring price formations. Specific patterns visible on price charts (like the head-and-shoulders, double tops/bottoms, triangles, and flags) reflect underlying supply and demand dynamics and trader psychology, which often lead to a particular outcome. Traders use chart patterns in trading strategies to identify and exploit recurrent market behaviors in a visually intuitive way, and to systematically capture potential trend reversals or continuations. Chart patterns bridge the gap between raw price action and actionable trade decision by encapsulating market psychology into visible shapes. The purpose is ultimately to give the trader a repeatable method to anticipate price moves. When integrated with proper risk management (like stops below pattern invalidation points) and confirmation (like volume spikes on breakouts), chart trading patterns improve the probability of a strategy’s success by focusing on the times when the market might move in one direction.
For example, a head-and-shoulders pattern is interpreted as a sign of an impending trend reversal from bullish to bearish. It visually represents a weakening in buying pressure each time the price makes a new high (the “head” being lower than the first “shoulder”), followed by a breakdown of support (neckline). Traders utilize head and shoulders patterns to anticipate and time entries/exits. A strategy might dictate selling (or shorting) when a head-and-shoulders completes and the price breaks the neckline, as this often precedes a decline.
Chart patterns have been studied academically for predictive power. For example, the head-and-shoulders pattern has been researched by economist. One study called “Head and Shoulders: Not Just a Flaky Pattern” by the Federal Reserve Bank of New York (Osler and Chang, 1995) found that head-and-shoulders patterns in currency markets did have some predictive ability to generate profits above random chance. Academic studies confirm the idea that chart patterns can play a meaningful role in technical analysis and help traders identify high-probability setups across various markets.
Chart patterns help in setting logical price targets and stop-loss levels, which is valuable for trading strategy formulation. For instance, in a triangle pattern, traders might set a target equal to the height of the triangle projected from the breakout point, and a stop just inside the triangle on the opposite side of the breakout. The pattern thus offers a convenient framework for risk/reward planning. A double bottom pattern signals a potential bullish reversal. A trader’s strategy could be to buy after price breaks above the peak between the two bottoms, with a stop below the bottoms, and a profit target based on the pattern’s height. Chart patterns give visual reference points (areas of support/resistance or breakout levels) which make it easier to decide where to enter a trade and where to exit. This is why many strategies include pattern recognition, because patterns inherently define the entry (breakout or confirmation point), stop (beyond the pattern failure point), and profit target (projection from pattern) in a way that is easily communicable and historically tested.
Chart patterns are self-fulfilling to an extent. Many traders see them and act accordingly, causing the expected move to materialize. For instance, if thousands of traders recognize a bull flag pattern (a consolidation after a strong up-move) and buy the breakout from the flag, their collective action helps propel the price upward as predicted. Chart patterns are a way to quantify market sentiment: a series of higher lows forming a ascending triangle indicates persistent buying on dips (bullish sentiment) and a flat resistance that if broken could lead to a surge as sellers capitulate.
In trading strategies, chart patterns serve as the primary signal or a confirmation tool. A strategy may revolve entirely around trading breakouts from patterns (a common approach for swing traders), or a strategy might use patterns to confirm signals from indicators. For example, a trader might combine an oscillator oversold signal with the presence of a rounding bottom pattern to increase confidence in a long trade. The pattern in this case provides context, it tells the trader the market has been gradually transitioning from a downtrend to an uptrend in a smooth curved fashion, bolstering the case that the oscillator’s bullish signal is legitimate.
The purpose of candlesticks in trading strategies is visually convey detailed price information and signal potential market turning points or continuations. A candlestick chart displays the open, high, low, and close for a given time period in a single symbol (the candlestick), making it easy for traders to interpret price action at a glance. Candlestick patterns help traders read the language of the market on a granular level and act as timely signals of sentiment shifts. They encapsulate short-term price dynamics (who’s winning, who’s losing, and how volatile the market is) in a format that traders find easy to interpret quickly. Candlesticks help in placing stops and targets when defining a trading strategy. Traders often set stops just below the wick of a bullish reversal candle (on the rationale that if the market goes below that low, the reversal failed), and targets based on recent swing highs or a measured move.
Originating from 18th-century Japanese rice traders, candlestick techniques have endured because they address the trading need of understanding the tug-of-war between buyers and sellers. In modern strategies, candlesticks remain indispensable for timing trades and confirming patterns, whether one is a day trader watching 15-minute candles or a swing trader looking at daily charts. The purpose of candlestick pattern is ultimately to improve a strategy’s accuracy. They ensure that trades are taken when price action itself is confirming the move. Trading with candlestick patterns blend statistical strategy with real-time price insight, an approach that highlights the enduring relevance of candlestick patterns in a trader’s toolkit.
Candlesticks patterns communicate market sentiment within each bar. The body of the candle (the difference between open and close) shows whether the session was bullish (close above open, typically a green or white body) or bearish (close below open, red or black body), and how strong the move was (a long body means a big price move). The wicks or shadows (the lines extending from the body) show the extremes of price and how far the price retracted from those extremes by close. By analyzing bodies and wicks, traders infer who was in control (buyers or sellers) and if momentum shifted during the interval. For example, a small body with long wicks (a candle often called a “doji” or similar) indicates indecision or equilibrium, as prices moved up and down significantly but closed roughly where they opened, suggesting neither side dominated. This might warn that a trend is losing steam. Candlesticks are integral to trading strategies as they form specific candlestick trading patterns that often signal shifts in sentiment. Patterns like the hammer, shooting star, doji, bullish engulfing, bearish engulfing, morning star, evening star, and so on, are built from one to a few candles and are widely used as entry/exit triggers. For instance, a hammer candle (a small body with a long lower wick and little upper wick, appearing after a decline) shows that sellers drove price sharply lower but buyers stepped in aggressively to push it back up by the close, a classic reversal signal suggesting the downtrend may be ending. A trading strategy might specify “If a hammer occurs at a support level, buy with stop below the candle’s low,” using the candlestick as the cue that sentiment is turning bullish.
Candlesticks in strategies help time entries and exits with precision. While broader chart patterns might tell a trader the general area to watch (say a support zone where a reversal might happen), candlesticks often provide the specific trigger. For example, a strategy could be “Go long when a bullish engulfing candlestick appears after a series of declining candles,” because that indicates a sudden shift from selling to strong buying pressure (the engulfing candle’s body fully covers the previous bearish candle’s range). Candlesticks offer relatively short-term signals that a strategy can exploit repeatedly. Many short-term trading strategies (including day trading and swing trading) rely heavily on candlestick formations since they form frequently and can be very telling in forecasting the next few bars.
Candlesticks are useful for identifying trend continuation or consolidation periods. For example, a series of small-bodied candles with wicks (so-called “spinning tops” or doji) might indicate consolidation. A strategy might prepare for a breakout trade, but hold off until a strong full-bodied candle breaks out of the range, confirming momentum return. On the other hand, during a strong trend, a strategy might use candlesticks to manage positions, for example, staying in a long trade as long as most candles are bullish with higher highs and higher lows, and only exiting when a clearly bearish candlestick pattern emerges (like a bearish engulfing or evening star).
Candlestick patterns condense a lot of information about price action psychology, such as who won the battle in that time period and how. Traders often memorize dozens of named patterns. The purpose of each is tied to likely outcomes. A bullish engulfing pattern, for instance, suggests a potential upward reversal because buyers not only beat sellers for the period, but erased the prior period’s losses entirely. A three-white-soldiers pattern (three consecutive long-bodied bullish candles) indicates strong sustained buying and often continuation higher. A strategy might say, “After a three-white-soldiers pattern in an uptrend, add to long positions on any minor pullback,” leveraging the strong momentum indicated. Conversely, a shooting star at the top of a rally, with a tiny body and a long upper wick, shows that buying euphoria was met with significant selling before close, typically a bearish sign. A strategy could short after a shooting star with a stop above its high, anticipating a trend reversal lower.
Candlestick analysis can be combined with indicators for enhanced trading strategies. Some strategies require indicator confirmation of candlestick signals. For example, a strategy might be “Go long on a hammer candlestick, but only if RSI was below 30 (oversold) prior to the hammer,” thereby increasing the probability that the hammer truly marks a reversal of an oversold market.
Technical indicators are are utilized in trading strategies as tools to quantify market conditions, generate trade signals, and confirm or filter trading opportunities. Technical trading indicators take raw price action and apply formulas to highlight certain aspects such as trend, momentum, volatility, or volume that might not be immediately obvious from the price chart alone.
The ways trading strategies incorporate technical indicators are listed below.
- Signal Generation: Many trading strategies use one or more indicators to produce entry and exit signals. For example, a classic strategy might use a Moving Average Crossover – when a short-term moving average crosses above a long-term moving average, it generates a buy signal (indicating an emerging uptrend), and a cross below generates a sell signal. Moving averages smooths price data to reveal the underlying trend by filtering out noise. An oscillator indicator like the Relative Strength Index (RSI) is used in strategies to signal potential turning points. An RSI reading above 70 is often taken as overbought (possible upcoming downturn), and below 30 as oversold (possible upturn). A mean-reversion strategy might thus say, “If RSI < 30, and price shows a basing pattern, then buy expecting a bounce; sell when RSI returns to 50.” Indicators convert price data into actionable metrics (like an RSI value) which strategies can benchmark against thresholds to decide when to act.
- Trend Identification and Confirmation: Indicators help determine whether a market is trending or ranging, and thus which strategy to apply. Indicators can be utilized as filters to ensure the strategy’s trades occur in favorable conditions. For example, strategies often use the 200-day moving average to gauge the long-term trend. A price above it suggests an uptrend bias, below it a downtrend bias. A strategy might only go long when the price is above the 200-day MA, aligning trades with the major trend. Indicators like the Average Directional Index (ADX) measure trend strength. A high ADX value can confirm a strong trend, signaling a trend-following strategy to stick with winners, whereas a low ADX indicates a sideways market where a mean-reversion strategy might be more appropriate.
- Momentum and Overbought/Oversold Conditions: Momentum indicators (e.g., RSI, Stochastics, MACD histogram) show the speed or magnitude of price moves. Trading strategies use these to anticipate reversals or continuations. An example usage is with the divergence between price and an indicator. If price makes a higher high but RSI makes a lower high (bearish divergence), a reversal strategy might trigger a short, because momentum is weakening behind the price rise. A convergence can confirm a move. Some strategies specifically trade on indicator patterns, like when the MACD line crosses above its signal line as a buy (common in many stock trading systems as a momentum shift signal). In range-bound markets, oscillators are heavily used. A strategy might short a rally when Stochastic > 80 (overbought in the range) and buy when Stochastic < 20 (oversold), effectively oscillating with the oscillator. Indicators serve to numerically define “too far” or “too fast” moves which often precede corrective swings.
- Volatility and Risk Management: Some trading strategies adapt position sizing or stop distances based on volatility indicators. The Bollinger Bands indicator, which plots standard deviation bands around a moving average, is used in strategies to gauge volatility and potential mean reversion points. For instance, a volatility contraction (bands narrowing) might signal an upcoming breakout, so a breakout strategy watches for a strong move beyond the bands. Conversely, hitting the upper band indicates price stretched to an extreme versus its recent average, which a contrarian strategy might use as a cue to fade the move (sell high, buy back when it returns to mean). ATR (Average True Range) is an indicator widely used to set stop-loss levels. For example, a strategy may set stops at 1.5 ATR from entry to account for typical volatility, thereby avoiding too-tight stops. ATR can also adjust position size. If ATR is high (volatile market), a strategy might take a smaller position to maintain consistent risk, whereas in low ATR conditions, position size might be increased.
- Indicator Combinations and Confirmation: Trading strategies often combine multiple indicators to improve reliability. For example, a popular combination is using a trend indicator (like moving average) and a momentum indicator (like RSI). The strategy might be to only take buy signals (say from a price pattern or moving average crossover) when RSI is also showing bullish momentum (maybe crossing above 50 or coming out of oversold). Another combination could be using volume indicators with price indicators, for example confirming a breakout signal given by price moving above a resistance, with an On-Balance Volume (OBV) rising, indicating volume supports the upward move. Many algorithmic strategies feed a variety of indicators into a model to decide on trades. The indicators become the input features that the strategy logic or algorithm weighs.
Trading strategies utilize indicators as tools to systematically interpret market data, define trends, measure momentum, indicate overbought/oversold extremes, confirm breakouts, and inform risk controls. They transform subjective chart reading into a set of numeric conditions, making strategy rules more testable and repeatable. A trading strategy might not need many technical indicators, even a single well-chosen indicator can greatly aid a trader (e.g., some trend-followers might use just a moving average as their guide). Others blend several to cross-verify signals. But in all cases, the use of technical indicators is about enhancing a strategy’s ability to identify quality trading opportunities and avoid poor ones by leveraging mathematical analyses of market behavior.

Backtesting and forward testing improve trading strategies by validating their performance and robustness before full deployment with capital. They serve as the experimentation and quality control phases for a strategy. Backtesting involves applying your trading strategy’s rules to historical market data to see how it would have performed in the past. Forward testing (also known as paper trading or walk-forward testing) tests the strategy in real-time market conditions (without risking real money, or with a very small position) to ensure the strategy works as intended in the current environment.
Back‑testing improves a trading strategy in three clear ways. First, it supplies hard metrics (profit‑and‑loss, win rate, drawdown, and Sharpe ratiol) that show whether the idea had an historical edge. A typical example is a test that uncovers a 50% drawdown, which warns the trader to add a filter or tighter stops before risking real money. Second, it enables systematic optimisation. The analyst can vary inputs (for instance, replace a 50‑day moving average with a 40‑ or 60‑day one) and compare results, while guarding against over‑fitting by reserving out‑of‑sample data. Third, it reveals behavioural facts such as longest losing streak, trade frequency, or sensitivity to market regimes.
Forward testing serves three main purposes. It checks the back‑tested edge in real‑time markets and shows whether the live results match past data. For example, it may reveal that transaction costs and slippage remove much of the expected profit. It trains the trader’s execution and psychology by exposing order‑handling issues and emotional stress before any real money is at risk. It also shows how the strategy performs under current market conditions, such as lower liquidity or new regulations, and prompts timely adjustments.
Technology in modern trading strategies acts as the enabler, accelerant, and innovator. Technology enables strategies to be tested and executed at speeds and scales far beyond human ability, accelerates the research and implementation cycle, and fosters innovation (like AI-driven strategies, HFT, crypto algorithmic trading) that keeps pushing the boundaries of what’s possible in markets. The result is that today’s markets are highly automated and efficient, and traders must leverage technology to remain competitive.
Technology has not eliminated the need for good trading strategy, but it has fundamentally changed how trading strategies are conceived (data-mining and modeling) and how they are deployed (automation and networked markets). In many cases, the edge of a modern strategy is inseparable from the technology that powers it. Those who effectively harness technology in their trading find they can exploit opportunities that would be invisible or unreachable without it, which is why virtually all successful trading operations now heavily invest in technological capabilities.
Algorithms today carry out most U.S. equity orders (about 60‑75%), and High‑Frequency Trading (HFT) firms use co‑located servers and ultra‑low‑latency links to exploit tiny price gaps in milliseconds. Fast computers let quants back‑test decades of data, tune parameters with Python, R, or MATLAB, and train machine‑learning models such as neural networks. Global electronic platforms give one laptop access to U.S. stocks, European futures, Asian forex, and even on‑chain DeFi, all through API links. Risk tools run in real time, auto‑stop losses, and scan news or Twitter for events that can trigger trades within seconds. Cloud computing lets funds spin up hundreds of virtual machines for Monte‑Carlo stress tests and then shut them down again to save cost. Retail traders share in these gains by renting algorithms, using drag‑and‑drop builders, or running code on a VPS. Execution algos (VWAP or TWAP) slice large orders to hide intent and cut market impact.
The best example of tech‑driven edge is Renaissance Technologies’ Medallion fund, which mines petabytes of data with advanced models and relies on high‑speed infrastructure. Without such hardware and code, its celebrated performance would not exist.
Traders adjust strategies for different markets by calibrating parameters to volatility and liquidity, respecting market-specific drivers, and possibly altering the tactical approach to fit the market’s behavior. A trader might have a core strategy template, but will tweak it when moving from one asset class to another. This adaptability is crucial because a one-size-fits-all approach seldom works equally well everywhere.
Markets are shaped by different participants and forces. Aadapting ensures the trading strategy aligns with the reality of each market. As an old saying goes, “Trade what you see, not what you think”, and what you see in each market will differ, so your strategy logic should see it clearly by being adjusted appropriately. Traders who adjust for different markets tend to have more consistent performance across them, while those who don’t may find a great equity strategy fails in forex or vice versa due to these unaccounted differences.
Different financial markets (forex, stocks, cryptocurrencies, or commodities) and even different instruments within those markets have unique characteristics, such as volatility, liquidity, trading hours, and fundamental drivers, and traders often need to adjust their trading strategies to account for these differences. Adapting a strategy to the specific market traded is crucial to maintain its effectiveness and manage risk appropriately.
The characteristics of different markets that traders consider when adjusting a trading strategy are listed below.
- Forex: Major pairs such as EUR/USD and USD/JPY are highly liquid, so tight‑spread scalping and 24×5 automation work. A trader may risk 20 pips on a EUR/USD day‑trade, yet widen the stop to 200 pips when the same template is applied to the more volatile XAU/USD cross. This keeps percentage risk constant. Exotic pairs carry wider spreads, so limit orders and larger profit targets offset transaction costs. Macroeconomic events (CPI, NFP, central‑bank meetings) can move prices abruptly. Many systems either flatten or tighten stops before such releases. If three signals would leave the trader long USD in several pairs, the risk module normally restricts exposure to the single strongest setup to avoid correlation overload. Some practitioners disable their bots during the swap‑rollover minute or at thin‑liquidity shift changes to reduce slippage.
- Stocks: Large‑cap shares and index futures like the E‑mini S&P provide deep liquidity for intraday breakouts, while small‑caps may need sliced limit orders to prevent slippage. Because cash equities trade only during the session, strategies must account for opening‑gap volatility and overnight risk. Many skip the first few minutes or hedge overnight. Earnings reports and SEC filings are primary drivers, so rules often close or down‑size positions the day before results. In US, the pattern‑day‑trading rules make high‑frequency scalping impractical for small accounts, so swing or position plays are common. Long‑term momentum, such as a 200‑day moving‑average crossover, exploits the market’s historical upward drift, but portfolio logic usually caps the number of positions in one sector to limit crisis‑period correlation.
- Crypto: Bitcoin, Ethereum, and alt‑coins trade 24×7 and can swing 10% or more in a day, so the same breakout system used on U.S. stocks must redefine a “daily” candle (often UTC) and widen the breakout threshold. Position size is cut because high leverage plus volatility can wipe out an account; many risk only a fraction of what they would in forex. Retail sentiment, not macro data, drives sudden spikes, so some traders add a momentum oscillator filter to avoid buying an already overstretched rally. Liquidity is thinner outside the top coins, options markets are young, and exchanges differ in risk controls, so most tactics stay with spot or perpetual futures and use hard‑coded exchange halt and maintenance windows. Despite these quirks, disciplined calibration of stops, targets, and event filters lets a core template survive the crypto personality.
Yes, combining multiple trading strategies is a common approach used by traders and investment firms to diversify risk, smooth out returns, and exploit different market conditions. Combining trading strategies is analogous to building a portfolio of uncorrelated assets. Traders can achieve more consistent overall performance by deploying several strategies that each have an edge but perform differently across market environments.
When we talk about combining trading strategies, it can happen in a few ways:
- Simultaneous Multi-Strategy Trading (Diversification): This is when a trader runs different strategies in parallel, potentially on the same account or across accounts. For instance, one strategy might be a trend-following system on daily charts, while another is a short-term mean reversion strategy on intraday moves. Each strategy individually will have its streaks of wins and losses, and importantly, their performance might be out of sync (when one lags, the other may excel). By combining them, the combined equity curve is often smoother, because the strategies can offset each other’s drawdowns. Academic research and practical results suggest that a portfolio of strategies can improve the Sharpe ratio, essentially getting a better risk-adjusted return than any single strategy alone. For example, one strategy might struggle in choppy markets but do great in trends, while another thrives in chop but underperforms in strong trends. Together, they cover more market scenarios. This kind of combination is essentially strategy diversification.
- Sequential Strategy Switching (Regime-Based): Here, a trader might switch between strategies depending on the market regime or conditions. For instance, they might follow a momentum/trend strategy during trending phases (say identified by certain trend indicators or low volatility regimes turning into high volatility), and switch to a mean-reversion or options income strategy during range-bound or high volatility mean-reverting phases. Sequential Strategy Switching is a more active combination where you decide which strategy to use when, often based on macro conditions or indicator filters. The improvement sought is always to use the best tool for the job. For example, during a strong bull market, a breakout trend strategy might be primary, but if the market transitions to sideways consolidation, the trader might pause the trend strategy and employ a range strategy (like selling strangles or iron condors in options to capture premium in a flat market). This requires correctly reading market conditions, which is challenging, but can yield a more optimized approach for each environment.
- Hybrid Strategy Integration: Sometimes, strategies are combined by integrating elements of one into another. For example, a trader could combine a fundamental strategy with a technical one, only taking technical signals on stocks that meet certain fundamental criteria. Or combining signals: e.g., a strategy might go long if either Strategy A OR Strategy B gives a buy signal (effectively broadening participation), or conversely require both Strategy A AND Strategy B to align before trading (tightening criteria for potentially higher accuracy). By doing so, the trader is effectively using multiple strategies’ logic in a single composite strategy. An example might be combining trend and mean reversion within one strategy. For example, keep a core trend-following position, but also allow a tactical counter-trend trade around that core when short-term oscillators indicate extremes, blending two approaches for possibly better overall performance.
The benefit of combining strategies is illustrated by the idea of uncorrelated returns. If Strategy X and Strategy Y have an uncorrelated or negatively correlated return stream, then the combined return will have lower variance. Quantitatively, this often leads to a higher Sortino or Sharpe ratio for the composite. In practice, many hedge funds operate multi-strategy portfolios (equity long/short, merger arbitrage, trend-following, etc. under one roof) to achieve steadier returns. For retail traders, even having one strategy for stocks and a different one for forex, for example, can diversify one’s income sources from trading.