Chart patterns for trading are a critical tool in market movement analysis. Chart patterns help traders identify future market movements. A chart pattern is a specific shape or formation on a price chart in technical analysis. Chart pattern reflects historical price movements and is used to anticipate future price trends. The patterns are based on historical statistics and market psychology. Chart patterns provide insights into how the market behaves in the future.
Reversal chart patterns signal a potential change in the market trend. Reversal chart patterns indicate a shift from an uptrend to a downtrend or vice versa. Continuation Chart Patterns suggest the current trend continues after a brief halt or consolidation. Bilateral Chart Patterns signal potential price movement in either direction. The price breaks out upwards or downwards.
Trading chart patterns work by analyzing past price movements. Chart patterns identify recurring shapes or structures that signal a possible trend reversal, continuation, or indecision. The patterns are critical because they help traders anticipate future price action. Chart patterns help manage risks and time market entries and exits. The recognition of these patterns allows traders to identify profit opportunities. It avoids potential losses, making them essential for successful trading strategies.
The type of chart patterns based on popularity and technical analysis are listed below.
- Reversal Chart Patterns
- Continuation Chart Patterns
- Bilateral Chart Patterns
- Head and Shoulders Pattern
- Inverse Head and Shoulders Pattern
- Double Top Pattern
- Double Bottom Pattern
- Triple Top Pattern
- Triple Bottom Pattern
- Cup and Handle Pattern

1. Reversal Chart Patterns
A reversal chart pattern indicates a change in an asset’s price trend. Current price movements reverse and move in the opposing direction. Patterns appear after sustained price movements, signaling potential shifts in sentiment. A reversal chart pattern is either bullish or bearish, depending on the direction of the expected price move. Bullish reversal patterns suggest that a downtrend is likely to turn upward, while bearish reversal patterns indicate that an uptrend is expected to reverse into a downtrend. Traders use these patterns to identify potential trend changes before they happen.
Reversal chart patterns work by providing visual clues that signal an impending trend reversal. Traders look for specific formations or shapes in price charts, such as head and shoulders, double tops, or double bottoms, which suggest a change in market direction. One advantage of reversal chart patterns is that they provide early signals of trend reversals. It allows traders to position themselves early, potentially maximizing profits from the new trend. Predicting market shifts before they occur is a valuable tool for many traders.
The patterns are applied in any market with price charts, including stocks, forex, and commodities. The patterns are most effective in markets with strong trends, as they are designed to identify moments when the trends are likely to change direction. The reliability of reversal chart patterns varies depending on the pattern and market conditions. No pattern is guaranteed to be accurate, and external factors influence market movements. Traders use other indicators to confirm the signals from these patterns.
Reversal chart patterns (Head and Shoulders, Double Top, and Triple Top) are the most successful chart patterns for achieving profitable technical analysis outcomes. Reversal chart patterns have a proven track record of identifying trend reversals, making them highly sought after by traders. The profitability of these patterns depends on how accurately a trader identifies them and acts upon the signal. A reversal pattern is one of the profitable chart patterns if executed correctly, but they carry inherent risks as market conditions sometimes deviate from expectations.
Bullish chart patterns include Cup and Handle, Ascending Triangle, and Bull Flag. Bearish chart patterns include Head and Shoulders, Descending Triangle, and Bear Flag. A sample image of the pattern shows three peaks, the middle one being higher than the others, forming the “head,” and the two others being “shoulders.” Traders confirm trend reversals with reversal chart patterns by analyzing volume or other technical indicators. Patterns such as double tops or bottoms require additional confirmation before traders act.
2. Continuation Chart Patterns
Continuation chart patterns indicate a temporary pause in the market trend before the price continues in the similar direction. Continuation chart patterns suggest consolidation phases where market participants accumulate or distribute assets before resuming the prior trend. The chart helps traders identify chances to enter trades in line with the dominant trend.
The patterns form when the price moves sideways, creating structures like flags, pennants, triangles, and rectangles. The price breaks out in the direction of the prior trend after consolidation. The breakout confirmed by increased trading volume, which signals strong participation from traders. One of the main advantages of continuation chart patterns is their ability to provide clear breakout signals, reducing uncertainty. The pattern works well in different timeframes, making them suitable for day trading and long-term investing. It complements technical indicators such as moving averages and volume analysis that improve accuracy in trade decisions.
The patterns are applied to multiple markets, including stocks, forex, commodities, and cryptocurrencies. Continuation chart patterns are most effective in trending markets where price movements are strong. Traders use them to confirm that a trend persists, allowing for strategic entry and exit points. The reliability of continuation chart patterns depends on the pattern type, market conditions, and volume confirmation. Patterns like flags and pennants are highly reliable, while ascending and descending triangles sometimes produce false breakouts. Combining the patterns with technical indicators increases their accuracy.
The formations indicate trend continuation. The patterns are part of bullish chart patterns that signal upward price movement. Continuation chart pattern belongs to bearish chart patterns as well, which indicate a continuation of downward trends. Bull flags and ascending triangles signal further gains in an uptrend. Bear flags and descending triangles suggest continued selling pressure in a downtrend. Recognizing these patterns helps traders align with market momentum. Vital details enhance the effectiveness of continuation chart patterns such as volume, which declines during consolidation and surges upon breakout, confirming trend continuation. The longer the consolidation period, the stronger the breakout tends to be. These patterns work best with trend indicators such as moving averages and RSI.
The formation is among the most successful chart patterns as it has a high probability of trend continuation. The structured nature gives traders reliable entry and exit points, making them a favored choice among professionals. The effectiveness is well-documented in technical analysis and trading strategies. The chart offers strong profit potential when used correctly, making it one of the profitable chart patterns. Traders who confirm breakouts with volume analysis and apply proper risk management achieve consistent gains. Institutional and retail traders widely use these patterns to maximize returns in trending markets.
3. Bilateral Chart Patterns
Bilateral chart patterns indicate market indecision, where the price breaks out in either direction. Bilateral chart patterns reflect a balance between buyers and sellers, leading to unpredictable breakouts. Traders analyze volume and confirmation signals to determine the likely direction. The bilateral chart patterns combine upward and downward price movements, creating symmetrical triangles, expanding triangles, and wedges. The market consolidates, and the breakout depends on external factors like economic events, news, or shifts in sentiment.
Buyers and sellers push prices within a narrowing or widening range, creating pressure before a breakout. The breakout direction is confirmed when price moves beyond key support or resistance levels with increased volume. Traders prepare scenarios for bullish and bearish chart patterns. The patterns provide flexibility, allowing traders to set up trades for long and short positions. The patterns help capture large price movements when volume confirms the breakout. Recognizing the formations lead to high-reward opportunities in volatile markets.
Forex, stocks, cryptos, and commodities frequently display bilateral chart patterns in markets with high volatility. They are common before major economic events, earnings releases, or significant geopolitical developments. The effectiveness of bilateral chart patterns depends on breakout confirmation. False breakouts occur without strong volume. Indicators like RSI, MACD, or Bollinger Bands improve reliability by identifying momentum shifts.
The patterns are hybrid formations, containing elements of bullish chart patterns and bearish chart patterns. Their ability to signal breakouts in either direction differentiates them from purely directional patterns. Successful application requires recognizing breakout zones and using volume as confirmation. Market context influences breakout strength, such as macroeconomic trends and institutional activity. Traders must be cautious in low-volume conditions.
Bilateral chart patterns are not among the most successful chart patterns due to their unpredictability. Traders who understand them use them effectively to capitalize on market moves. The bilateral chart patterns are part of profitable chart patterns when used with clear breakout confirmation and risk management. Large price swings provide strong profit potential, but misinterpretation leads to losses.
4. Head and Shoulders Pattern
The head and shoulders pattern is a technical analysis formation that signals a potential reversal in the prevailing price trend. The head and shoulders pattern consists of three peaks, which are the left shoulder, the head, and the right shoulder. The head is the highest peak, flanked by two lower peaks on either side, resembling a head and two shoulders.
The head and shoulders pattern forms after a strong upward trend. The price rises to form the right shoulder, which is lower than the head but higher than the left shoulder. The neckline is drawn by connecting the lows between the shoulders and the head. A break below the neckline indicates a potential trend reversal from a bullish to a bearish market condition. The entry point is after the breakdown of the neckline, with the stop above the right shoulder and the target proportional to the distance between the head and the neckline. The Inverse Head and Shoulders chart pattern, however, which is part of the bullish chart patterns, signals a reversal from a downtrend to an uptrend when the price breaks above the neckline.
The head and shoulders pattern is considered one of the most successful chart patterns for predicting trend reversals. Its reliability stems from its clear structure and the psychological market dynamics it represents. Traders use the pattern to anticipate significant price movements, making it a valuable tool in technical analysis. The pattern is applied across various markets, including forex, stocks, cryptos, and commodities. Forex traders confirm its strength using price behavior rather than volume. Its versatility makes it a widely used tool among traders in different asset classes.
A head and shoulders pattern is a reliable indicator, but it only works if it is correctly identified and confirmed. Traders use additional indicators or volume analysis to confirm the pattern’s validity. No pattern guarantees success, but the head and shoulders pattern has a strong track record when used correctly. The head and shoulders patterns are bearish chart patterns that reflect a shift in market sentiment, where traders lose confidence in the uptrend, leading to increased selling pressure and a potential decline in price. Its structure and the market psychology it represents make it a valuable tool for traders anticipating a change in market direction.
Head and shoulder patterns are key market dynamics indicators, showing when bullish strength gives way to bearish control. The head and shoulders pattern are profitable chart patterns for traders across various markets when used correctly.

5. Inverse Head and Shoulders Pattern
The Inverse Head and Shoulders pattern is a well-known reversal formation in technical analysis, signaling a shift from a downtrend to an uptrend. Inverse Head and Shoulders is the opposite of the standard head and shoulders pattern, which indicates a bearish reversal. The pattern suggests that selling pressure is diminishing while buying momentum is increasing, making it a key signal for traders looking for potential bullish movements.
The pattern consists of three main components, which are the head, which forms the lowest point, and two shoulders, which create higher lows on either side. A neckline connects the peaks of shoulders and acts as a critical resistance level. It confirms the trend reversal and suggests a potential upward movement when the price breaks above the neckline with strong volume.
The effectiveness of the Inverse Head and Shoulders pattern lies in its ability to provide traders with a clear entry point and a measurable price target. The projected price movement after the breakout equals the distance between the head and the neckline. It makes it a valuable tool for setting profit targets and stop-loss levels. Increased volume during the breakout further enhances its reliability.
The pattern is widely used in multiple financial markets, including stocks, forex, futures, and cryptocurrencies. Forex traders use order flow analysis instead of volume to confirm the pattern’s strength. It is effective in markets that experience prolonged downtrends followed by strong reversals. The pattern helps traders identify early signs of trend changes, allowing them to position themselves before a major price surge.
The Inverse Head and Shoulders patterns are considered one of the most successful chart patterns because their reliability depends on proper confirmation. A breakout above the neckline with strong volume is crucial for reducing the risk of false signals. Traders use additional indicators like RSI and MACD to validate the pattern and improve accuracy.
Bullish chart patterns mark the transition from bearish to bullish momentum. It is favored for its structured formation, making it easier to identify than other reversal patterns. Estimating a price target based on the pattern’s height appeals to short-term and long-term traders.
One of the most profitable chart patterns is the Inverse Heads and Shoulders pattern, but only if executed correctly. Maximizing gains is confirming the breakout and managing risk with stop-loss placements. Traders who follow volume trends and market conditions use the pattern effectively to capture upward trends and secure profitable trades.

6. Double Top Pattern
The Double Top pattern is a well-known bearish chart pattern that signals an uptrend’s end and a downtrend’s beginning. Double Top Pattern forms when the price reaches a resistance level twice but fails to break higher, indicating a shift in market sentiment from buying pressure to selling dominance. Traders use the pattern to anticipate price declines and take short positions accordingly.
Two peaks of equal height separated by a trough form the Double Top pattern, which visually resembles the letter “M.” The neckline is the lowest point between the peaks, a crucial support level. A break below the level confirms a bearish reversal. The price initially rises to form the first peak before pulling back. It attempts another rally, forming the second peak at roughly the same level. A confirmed downtrend begins when the price fails to break higher and declines below the neckline with strong selling trend. The expected decline equals the height between the peaks and the neckline.
The pattern is highly effective when supported by technical indicators such as RSI divergence or decreasing volume at the second peak, which signals weakening momentum. Institutional traders use it in conjunction with trendline analysis to validate potential breakdowns. A retest of the neckline as resistance after the breakdown increases the probability of a sustained downtrend. The psychology behind the pattern reveals shifting market sentiment. The first peak reflects bullish optimism, while the second peak suggests hesitation. Fear and selling pressure increase when buyers fail to push past previous highs. Market makers sometimes trigger false breakouts to trap retail traders before an accurate breakdown occurs.
The pattern is used on daily and weekly charts, but it is helpful on shorter timeframes, making it useful for day traders. Double Top signals the end of long-term bull markets in macroeconomic trends, particularly in overextended stocks or commodities. It results in a strong bullish chart pattern if the price unexpectedly breaks above the second peak instead of declining, leading to further upside. The time gap between the two bottoms affects its effectiveness. A wider formation indicates a stronger reversal. The pattern provides a clear reversal signal with a defined price target, allowing traders to make informed decisions. Its structure makes it easier to recognize, and confirmation through volume expansion strengthens its reliability. Proper risk management enhances its effectiveness. The double top pattern is widely used in stocks, forex, futures, and cryptocurrencies. The pattern appears frequently in trending assets where price action meets strong resistance.
The Double Top is among the most successful chart patterns when volume increases during the breakdown. False breakdowns occur, requiring additional confirmation through momentum indicators or moving averages. It falls under reversal patterns as a bearish chart pattern, marking a transition from bullish to bearish conditions. Successful execution depends on waiting for a confirmed neckline break. Traders must monitor volume for validation and be cautious of false signals. Stop-loss placement above the second peak minimizes risk exposure. The Double Top pattern ranks among profitable chart patterns with proper confirmation and risk management. Traders who follow volume trends and wait for a substantial breakdown maximize profit potential.

7. Double Bottom Pattern
The Double Bottom pattern is a well-recognized bullish chart pattern used in technical analysis to identify potential trend reversals. Double Bottom pattern signals a shift from a downtrend to an uptrend when price forms two consecutive lows at approximately the same level, creating a “W” shape. The formation suggests sellers lose momentum while buyers gain strength, leading to a potential price increase. The formation is different from bearish chart patterns that indicate further declines.
The pattern consists of two distinct lows with a peak (retracement) in between. The neckline, which connects the highs of the retracement, acts as a resistance level. A confirmed breakout above the neckline signals the end of the downtrend and the beginning of a bullish move. The price declines to a support level, bounces, and retests the same support level before rising again. The second low indicates that sellers were unable to push prices lower, which suggests a reversal. The bullish trend is confirmed when the price breaks above the neckline, accompanied by substantial buying volume. Traders set price targets based on the distance from the bottom to the neckline.
The Double Bottom pattern is most reliable when it follows a significant downtrend, as it signals the formation of a strong support zone. Institutional traders monitor the pattern for accumulation phases, where large buying interest prevents further price declines. The pattern’s effectiveness increases when the second bottom is formed with higher volume, reflecting growing market confidence. The pattern represents psychologically shifting market sentiment from bearish to bullish. The first low tests investor confidence, while the second low confirms the presence of strong demand. Market makers manipulate price action around the second bottom to trigger stop-loss orders before a true breakout, requiring traders to wait for confirmation.
The Double Bottom pattern is part of more complex formations, such as an Inverse Head and Shoulders or larger multi-bottom structures. It is effective in markets that have experienced excessive selling pressure, as it indicates a probable trend reversal fueled by short-covering and renewed buying interest. The pattern provides a clear reversal signal that helps traders identify early buying opportunities. Its measurable price target allows for well-structured trade setups. The pattern is versatile, appearing across various timeframes and financial markets.
The Double Bottom is widely used in stocks, forex, futures, and cryptocurrencies. It is effective in trending markets where support levels are well-defined. Forex traders use alternative indicators like order flow analysis to confirm the pattern’s strength. The Double Bottom is considered one of the most successful chart patterns due to its ability to provide strong reversal signals. Its reliability improves when the second low forms with strong buying pressure and is confirmed by a breakout above the neckline. False breakouts occur, which makes additional confirmation through indicators like RSI or MACD essential.
The time gap between the two bottoms affects its effectiveness. A wider formation indicates a stronger reversal. Traders must remain cautious of false breakouts if price temporarily moves above the neckline before reversing downward.
The Double Bottom chart pattern is frequently used by traders seeking high-probability setups. The pattern is one of the profitable chart patterns when traded with proper risk management. Traders who wait for confirmation and manage stop-loss placements effectively capitalize on its strong breakout potential. Its high success rate makes it a valuable tool in technical analysis strategies.

8. Triple Top Pattern
The Triple Top pattern is a well-established bearish chart pattern that signals the reversal of an uptrend into a downtrend. Triple Top pattern forms when the price reaches a resistance level three times without breaking higher, creating an “M” shape. Trading opportunities for shorting are limited due to the repeated rejection, which indicates that buying pressure is fading while sellers gain control.
The pattern consists of three peaks at roughly the same price level, separated by two troughs. The neckline, drawn at the lowest point between the peaks, serves as a support level. A confirmed breakout below the neckline signals the transition from a bullish to a bearish trend. The price rises to a resistance level, faces rejection, and pulls back, forming the first peak. Buyers make another attempt to push higher, creating the second and third peaks, but fail each time. A bearish move occurs when sellers take control and the price breaks below the neckline. The expected decline equals the height from the peaks to the neckline.
The Triple Top pattern is highly effective in markets that have experienced prolonged uptrends. The pattern signals that institutional investors distribute their holdings before a larger decline. Volume decreases with each peak, indicating weakening bullish momentum. An intense breakdown with increasing volume enhances the probability of a sustained downtrend. Market psychology affects the pattern. The first peak represents strong bullish sentiment, the second introduces doubt, and the third signals exhaustion. A panicked trader buying near the peak fuels selling pressure during the stage. Market makers trigger false breakouts before unfolding the actual downward move.
The Triple Top is part of broader patterns, such as a Head and Shoulders Top, reinforcing its bearish nature. The time gap between the peaks influences the pattern’s reliability in high-volatility markets, more extended formations tend to produce stronger breakdowns. It leads to a strong bullish chart pattern if the price fails to break down and surges above the third peak, trapping short-sellers. The pattern provides a clear reversal signal, making it valuable for traders identifying short opportunities. It allows for precise risk management, as stop-loss levels is placed above the resistance. Trade execution is more strategic with the structure’s measurable price target.
The Triple Top is widely used in stocks, forex, futures, and cryptocurrencies. It is effective in markets that have experienced extended bullish trends. Forex traders use order flow analysis instead of volume to confirm the pattern’s strength. The Triple Top is one of the most successful chart patterns, as confirmed by its strong selling volume. Its reliability improves when the second and third peaks show lower momentum, signaling trend exhaustion. False breakouts are probable, so additional confirmation with technical indicators like RSI or MACD is essential.
A confirmed neckline breakout is necessary for validation. Traders must watch for decreasing volume at the peaks and increasing volume at the breakdown. False signals occur if price briefly dips below the neckline but quickly rebounds. Proper risk management is crucial to avoid premature entries. It is one of the profitable chart patterns when traded with confirmation and disciplined risk management. Shorting after the neckline breakdown and setting stop-loss levels above the resistance zone allows traders to capitalize on its strong downward move.

9. Triple Bottom Pattern
The Triple Bottom is a bullish chart pattern that signals the reversal of a downtrend into an uptrend. Triple Bottom Pattern forms when the price tests a support level three times without breaking lower, indicating strong buying interest and weakening selling pressure. The pattern consists of three consecutive lows at similar price levels, separated by minor rallies. The neckline, drawn at the highest point between these lows, acts as a resistance level. A breakout above the level confirms the bullish reversal.
The price declines to a key support level, rebounds, and repeats the process twice. The price moves upward if sellers fail to push the price lower on the third attempt. A confirmed breakout above the neckline marks the beginning of an uptrend, with the projected price target being the height from the lows to the neckline. It provides a clear trend reversal, helping traders identify buying opportunities. The well-defined structure makes risk management easier, allowing precise stop-loss, below the support area, and target placement, proportional to the height of the pattern. Its flexibility across various timeframes enhances usability.
The Triple Bottom appears in stocks, forex, futures, and cryptocurrencies. It is beneficial in markets with strong downtrends that show signs of buyer accumulation. Forex traders confirm its strength using price behavior rather than volume. Its effectiveness increases when additional indicators, such as RSI or MACD, support the reversal. Waiting for confirmation, avoid false signals. The pattern is most effective after a prolonged decline, where institutional investors accumulate positions. It is a sign of seller exhaustion, which is accompanied by increasing buying momentum. Bearish chart patterns rely on continued selling pressure and precede further declines rather than reversals.
A confirmed neckline breakout is crucial for validation. Traders must monitor price movements for sustained upward momentum. Broader market conditions, such as economic trends, impact the success of the Triple Bottom pattern. It is considered one of the most successful chart patterns due to its strong reversal signal and reliability when confirmed. The Triple Bottom is among the profitable chart patterns, offering high-reward opportunities when traded correctly. Effective entry timing and risk management increase profitability.

10. Cup and Handle Pattern
The Cup and Handle is a bullish chart pattern that signals trend continuation. Cup and handle pattern forms when the price declines, gradually recovers in a rounded shape, creating a “U” shape, and experiences a short pullback before breaking out. The structure reflects market consolidation, where buyers regain control after a temporary decline. The pattern consists of a cup shaped like a rounded bottom, followed by a handle, and a more minor downward pullback before a breakout. It indicates a shift in sentiment where sellers exhaust their influence, allowing buyers to push the price higher. A successful breakout confirms the continuation of an existing uptrend.
The price initially falls, creating the cup as it stabilizes and climbs back toward previous highs. The price forms a slight downward handle when it reaches resistance, which is a final test before the uptrend resumes. A breakout above the handle signals a strong buying opportunity, with the projected price increase equal to the cup’s depth. The pattern provides a structured trade setup, offering clear entry and exit points. The formation allows for strategic stop-loss placement below the handle, reducing risk. It reflects market psychology, where the cup phase represents accumulation, while the handle tests conviction before momentum accelerates.
The Cup and Handle pattern appears in stocks, forex, futures, and cryptocurrencies, adapting to different timeframes. Forex traders rely on price movement instead of volume for confirmation. Its reliability increases when the handle is shallow, indicating strong momentum. A failed breakout becomes a bearish chart pattern that emphasizes the need for confirmation before entering a trade. A breakout above the handle triggers a trade entry, with price targets set using the cup’s depth. Risk is managed by placing stop-loss levels just below the handle and a target at least equal to the distance between the bottom of the cup and the breakout level. Additional indicators, such as RSI or moving averages, improve trade confidence. The Cup and Handle pattern ranks among the most successful chart patterns due to its consistent trend continuation. As one of the profitable chart patterns, it provides high-probability trade opportunities when executed with proper risk management and confirmation techniques.

11. Inverted Cup and Handle Pattern
The Inverted Cup and Handle is a bearish chart pattern that signals the continuation of a downtrend. Inverted Cup and Handle forms when the price creates an upside-down rounded top followed by a minor upward pullback before breaking lower. The structure represents a failed recovery attempt before further decline. The pattern consists of an inverted cup, showing a gradual loss of bullish momentum, followed by the handle, and a minor upward retracement before the price resumes downward. It forms after a strong downtrend, confirming that sellers remain in control. A breakdown below the handle signals a continuation of the bearish movement.
The price rises initially, forming the rounded cup as buyers weaken. It experiences a brief rally (the handle) as short-term traders attempt to push higher. The price drops below the handle’s low when the rally fails, which confirms the bearish breakout. The expected price target is equal to the height of the cup subtracted from the breakdown point. The pattern provides an early bearish continuation signal, allowing traders to enter short positions with well-defined risk levels. The structure helps traders place stop-loss orders above the handle’s high while setting realistic profit targets. It reflects market psychology, where the cup phase represents distribution, and the handle serves as the final test before selling pressure increases.
The Inverted Cup and Handle appears in stocks, forex, futures, and cryptocurrencies. Forex traders confirm patterns using price action and momentum indicators like RSI and MACD. Its reliability improves when the handle is shallow, showing weaker buying attempts. A failed breakdown lead to a bullish chart pattern, reversing the trend instead of continuing downward.
A confirmed breakdown below the handle signals trade entry, with profit targets set using the cup’s depth. Risk is managed by placing stop-loss levels just above the handle’s high. Traders combine the pattern with moving averages or trendline analysis for confirmation. The Inverted Cup and Handle pattern is among the most successful chart patterns for trend continuation, offering traders a reliable setup for shorting opportunities. Profitable chart patterns allow for high-reward trades when executed with confirmation and proper risk management.

12. Flag and Pennant Patterns
The Flag and Pennant Patterns are continuation chart patterns that signal a brief consolidation before price movement resumes toward the prevailing trend. Flags are rectangular formations with parallel trendlines, while pennants have converging trendlines forming a small triangular shape. The patterns reflect a short pause in market activity before the next price move.
The formations develop in three stages, which are sharp flagpole move, a consolidation phase where price moves in a narrow range, and a breakout in the trend’s direction. The consolidation phase allows the market to absorb recent price action before the trend resumes. Traders estimate profit targets by measuring the flagpole’s height and applying it to the breakout point.
One of the key benefits of these patterns is their high probability of success, which makes them one of the most successful chart patterns for trend continuation. The structure provides precise entry and stop-loss levels, improving trade precision. The patterns are used in trending markets and are adapted to different timeframes.
The patterns are common in stocks, forex, futures, and cryptocurrencies. Volume confirmation is less reliable in forex, so traders rely on momentum indicators like MACD or RSI to confirm breakout strength. The pattern duration varies, but they are most effective in markets with strong trends.
Bullish chart patterns and bearish chart patterns form depending on the trend’s direction. Traders must watch for false breakouts, which occur when price briefly moves outside the pattern before reversing. Proper confirmation increases trade reliability. Flag and Pennant Patterns are profitable chart patterns when traded correctly. The effectiveness of Flag and Pennant Patterns depends on precise execution, making them essential tools for momentum traders.
13. Flag Pattern
The Flag pattern is a continuation chart pattern that signals a brief consolidation before the price resumes its prior trend. Flag pattern forms after a firm price movement, followed by a compact, sloped channel that temporarily moves against the prevailing trend. The structure reflects a market pause before momentum resumes.
The flagpole represents the initial sharp move, and the flag represents the narrow range in which price consolidates. The breakout from the consolidation confirms trend continuation. It is a bullish chart pattern or a bearish chart pattern depending on the preceding trend. The price moves sharply in one direction, creating the flagpole. A brief consolidation follows, forming a parallel or slightly sloped channel. The continuation of the trend is confirmed once the price breaks out of the range in the initial trend’s direction. The projected target is measured by adding the flagpole’s length to the breakout point.
The Flag pattern provides an early entry signal into a trend continuation, helping traders capture momentum-driven moves. Flag pattern’s clear structure offers precise entry and exit levels, improving risk management. The psychological aspect reveals market indecision before a renewed push in the dominant direction. It appears in stocks, forex, futures, and cryptocurrencies. Traders confirm its strength in forex using price action and momentum indicators instead of volume. Its reliability is highest in strong trends but weakens if the flag extends too long. A failed breakout turns it into a reversal setup rather than a continuation.
The breakout point is the key trigger for trade entries, with price targets based on the flagpole’s length. Stop-loss levels are placed near the opposite end of the flag to manage risk. Combining the pattern with trend indicators enhances trade accuracy. The Flag pattern is one of the most successful chart patterns, frequently leading to trend continuations when confirmed. The profitable chart patterns allow traders to capitalize on strong momentum while maintaining controlled risk exposure.
14. Bullish Flag Pattern
The Bullish Flag Pattern, also known as bull Flag Pattern, is a continuation chart pattern that signals the resumption of an existing uptrend after a brief consolidation. The Bull Flag Pattern forms when a strong price rally, known as the flagpole, is followed by a temporary sideways or slightly downward movement, creating the flag. The pattern reflects a pause in market momentum before buyers regain control and push the price higher.
The pattern appears in strong uptrends, serving as a bullish chart pattern that indicates temporary consolidation before the trend resumes. It develops in three stages. The pole formation is where a sharp upward movement occurs. The consolidation phase is where price moves in a narrow range. The breakout, which confirms the continuation of the trend. The expected price increase after the breakout is often estimated using the flagpole’s height.
One of the key advantages of the Bull Flag Pattern is its ability to provide traders with well-defined entry and exit points. It helps manage risk effectively, as stop-loss levels are placed just below the flag’s lower boundary. The pattern enables precise profit targeting, making it a valuable tool for traders looking to maximize gains while maintaining controlled risk exposure.
The Bull Flag is highly reliable when it forms in trending markets. The Bull Flag is widely used across various asset classes, including stocks, forex, futures, and cryptocurrencies. Volume analysis is less effective in forex trading, so traders use momentum indicators like RSI and MACD to confirm breakouts. The pattern is among the most successful chart patterns, with studies showing a success rate of 75-80% when correctly identified. False breakouts happen, emphasizing the need for confirmation before entering a trade.
A failed breakout results in a shift to bearish chart patterns, leading to a reversal instead of a continuation. Traders must combine the pattern with other technical indicators and market conditions. The pattern duration varies, lasting from a few days to several weeks, depending on market volatility and trend strength.
Profitable chart patterns like the Bull Flag Pattern are effective if implemented correctly. It offers traders a high-probability setup in trending markets, making it a preferred choice for traders seeking strong continuation signals.

15. Bearish Flag Pattern
The Bearish Flag Pattern, also known as Bear Flag Pattern, is a continuation chart pattern that appears in strong downtrends, signaling a temporary pause before the trend resumes. Bear Flag Pattern forms when a sharp price drop, known as the flagpole, is followed by a consolidation phase that moves slightly upward or sideways, forming the flag. The pattern reflects a brief period of buying pressure before sellers regain control, leading to a further decline.
The bearish Flag chart pattern consists of two key elements, which are the initial sharp decline and the consolidation that follows. The flag phase represents a temporary counter-trend movement where the market stabilizes before resuming the downtrend. A confirmed breakdown below the flag’s lower boundary indicates that sellers have reasserted dominance, continuing the downward momentum.
A major advantage of the pattern is its ability to provide structured trade setups with precise entry and exit points. Traders place stop-loss orders above the flag to manage risk while using the flagpole’s height to project potential price targets. The tool helps identify continuation opportunities in trending markets.
The Bear Flag is seen in stocks, forex, futures, and cryptocurrencies, making it widely applicable. Forex traders use indicators like MACD and RSI since volume confirmation is less reliable in forex. It has a high probability of continuation when identified adequately as it is one of the most successful chart patterns. False breakdowns occur, emphasizing the need for additional confirmation before executing trades.
A failed breakdown results in a shift toward bullish chart patterns, leading to an unexpected reversal instead of continuation. A trader’s accuracy is improved by considering broader market trends and additional technical indicators. The pattern duration varies, lasting from a few days to several weeks, depending on market conditions.
The Bear Flag is ranked among the profitable chart patterns, particularly effective in strong downtrends. Trades based on the Bear Flag Pattern are likely to succeed when implementing risk management and confirmation strategies.

16. High Tight Flag Pattern
The High Tight Flag Pattern is a bullish chart pattern that signals the continuation of a powerful uptrend after a brief consolidation. The pattern occurs after a powerful price rally, doubling in value quickly. The subsequent consolidation phase remains tight, with minimal retracement, indicating strong buyer commitment and limited selling pressure.
The pattern develops in two main stages, which are an aggressive price surge forming the flagpole and a tight, sideways consolidation forming the flag. The breakout occurs when the price moves above the upper boundary of the flag, resuming the prior uptrend. Traders use the height of the initial surge to estimate the breakout’s potential target, which makes the helpful pattern for setting profit expectations.
One of its key advantages is its ability to provide high-probability trade setups with well-defined risk management. Stop-loss placement becomes more precise since the retracement in the flag phase is shallow, which reduces potential downside risk. The pattern leads to explosive breakouts which makes it one of the most successful chart patterns for momentum trading.
The High Tight Flag is widely used across various financial markets, including stocks, forex, futures, and cryptocurrencies. Increased trading volume during the breakout strengthens its reliability in stocks. Volume confirmation is less effective than momentum indicators like RSI or MACD in confirming a forex pattern. The formation requires strict confirmation due to its steep rally and limited consolidation, as failed breakouts cause sudden reversals.
The pattern is among the profitable chart patterns when traded correctly with a reported success rate exceeding 80%. An established bullish trend remains intact with a High Tight Flag, confirming that it remains intact. It shifts into a bearish chart pattern if the breakout fails and price moves below the consolidation range, which signals potential weakness. Proper risk management and additional technical confirmation maximize returns while minimizing potential losses.

17. Pennant Pattern
The Pennant Pattern is a continuation chart pattern that signals a brief consolidation before price resumes its prior trend. Pennant Pattern forms after a firm price movement, where the market temporarily pauses, creating a small triangular shape with converging trendlines. The pattern reflects reduced volatility before a breakout occurs.
The pattern consists of three key phases, the first of which is the flagpole representing the initial sharp move. The consolidation phase, where price fluctuates within narrowing trendlines. The breakout, which confirms trend continuation. Traders estimate price targets using the height of the flagpole, applying it to the breakout point.
One of its main advantages is its high probability of success, making it one of the most successful chart patterns for trend continuation. The pattern provides well-defined entry and stop-loss levels, allowing traders to manage risk effectively. The pattern is used in fast-moving markets due to its ability to indicate strong directional momentum.
Pennant Pattern appears in various financial markets, including stocks, forex, futures, and cryptocurrencies. Forex traders use momentum indicators like MACD and RSI to confirm breakouts without volume confirmation. The pattern’s reliability improves in strong trending environments.
The emergence of bullish chart patterns and bearish chart patterns depends on the trend direction. Traders must watch for false breakouts, where price briefly moves outside the pennant before reversing. Additional technical confirmation enhances accuracy of the Pennant Patterns. The patterns are profitable chart patterns traders use to profit from trend momentum. Proper execution and risk management are essential for maximizing returns while minimizing losses.
18. Bullish Pennant Pattern
The Bullish Pennant Pattern is a continuation chart pattern that signals a brief consolidation before an uptrend resumes. Bullish Pennant Pattern forms after a strong upward price movement, where the market pauses within a tiny triangular formation before breaking out in the direction of the prevailing trend. The pattern reflects market confidence, with buyers maintaining control before increasing prices.
Bullish Pennant Pattern consists of three key phases, the flagpole, representing the initial price surge, the consolidation phase, where price moves within converging trendlines forming a pennant, and the breakout, which confirms the pattern and signals further upside momentum. Traders estimate profit targets by measuring the flagpole’s height and projecting it from the breakout point.
An advantage of the pattern is its high probability of success, which makes it one of the most successful chart patterns for trend continuation. It provides precise entry and stop-loss levels, enabling effective risk management. Traders place stop-loss orders below the pennant’s lower boundary to minimize downside risk while targeting strong upside moves. The Bullish Pennant Pattern is used in stocks, forex, futures, and cryptocurrencies. RSI and MACD are used by traders when volume confirmation is less reliable in forex to validate breakouts. The pattern’s reliability increases in strong uptrends, as momentum tends to sustain price breakouts.
The formation indicates continued upward movement, which is a bullish chart pattern. Traders must be cautious of false breakouts, where price briefly moves above the pennant before reversing. Confirming the breakout with additional indicators improves trade accuracy. The Bullish Pennant is among the profitable chart patterns offering traders strong opportunities in trending markets. Proper confirmation ensures traders capitalize on upside moves while avoiding false signals leading to bearish chart patterns.

19. Bearish Pennant Pattern
The Bearish Pennant Pattern is a continuation chart pattern that forms after a sharp decline, signaling a brief consolidation before the downtrend resumes. Bearish Pennant Pattern appears as a small triangular structure with converging trendlines, reflecting a temporary pause in selling pressure before price breaks lower.
The bearish chart pattern develops in three phases, an initial decline, creating the flagpole, a consolidation phase, where price fluctuates within narrowing trendlines, a breakdown, where price drops below the pennant’s lower boundary, confirming the bearish trend’s continuation. The expected price movement is measured by applying the flagpole height to the breakout point.
The pattern provides precise trade setups with well-defined risk management, which makes it one of the most successful chart patterns. Stop-loss levels are placed above the pennant to limit losses, while the breakout direction guides profit targets. The pattern is used in stocks, forex, futures, and cryptocurrencies in strongly trending markets. Momentum indicators such as MACD and RSI are used in forex, where volume confirmation is less effective, to confirm breakouts. The pattern’s reliability increases when it aligns with broader market trends, reinforcing its role as a high-probability signal.
The pattern suggests continued selling pressure unlike bullish chart patterns, which indicate upward movements. Traders must be cautious of false breakdowns, where price temporarily dips below support before reversing. Confirming signals with additional indicators enhances accuracy and reduces risk. The Bearish Pennant pattern offers substantial opportunities in declining markets, classifying it among profitable chart patterns. Proper execution ensures traders capitalize on bearish momentum while maintaining controlled risk exposure.

20. Triangle Pattern
The Triangle Pattern is a chart pattern that forms when price action narrows between converging trendlines, signaling a period of consolidation before a breakout. Each triangle pattern shows potential movement based on market dynamics, which are ascending, descending, and symmetrical triangles.
The pattern develops as buyers and sellers gradually push prices into a tighter range. Breakouts determine whether they act as bullish chart patterns or bearish chart patterns. Traders estimate price targets by measuring the triangle’s height and applying it to the breakout point. A key advantage of the formation is its predictive strength, providing clear entry points and defined stop-loss levels. The Triangle Pattern ranks among the profitable chart patterns that offer structured trade setups based on breakout direction when properly executed.
The Triangle Pattern is applied in stocks, forex, and futures. Since volume confirmation is less effective in forex, traders rely on momentum indicators for validation. Its reliability depends on the triangle type and the prevailing trend, with stronger breakouts occurring when aligned with market momentum. It is not one of the most successful chart patterns, but it remains a valuable tool for identifying breakouts. Careful risk management and confirmation help traders capitalize on profitable moves while avoiding false signals.
21. Ascending Triangle Pattern
The Ascending Triangle Pattern is a continuation chart pattern that forms when price action creates a series of higher lows while facing resistance at a horizontal level. Ascending Triangle Pattern signals increasing buying pressure and is seen as a bullish chart pattern, indicating potential upward movement.
The pattern develops as buyers push prices higher, creating higher lows, while sellers maintain a resistance level. The narrowing price range results in a breakout above resistance, confirming the pattern and leading to a strong upward move. Traders measure the breakout target by applying the height of the triangle’s base to the breakout point.
A key advantage of the formation is its predictive accuracy, which makes it one of the most successful chart patterns for identifying trend continuation. It provides structured trade setups with defined entry points and stop-loss placement below recent lows, allowing for effective risk management. The breakout level serves as a trigger for long positions, increasing trade precision. The Ascending Triangle Pattern is used in stocks, forex, and futures. Forex traders rely on price momentum indicators like RSI and MACD to validate breakouts. The pattern’s reliability is highest in strong uptrends, where price breakouts tend to gain momentum.
Failed breakouts lead to reversals despite bullish chart patterns, making the formation bearish chart patterns if price moves below support. Traders must monitor false breakouts and confirm signals with additional indicators before entering positions. The Ascending pattern Triangle provides high-probability trade setups when executed correctly, ranking it among profitable chart patterns. Its structured breakout strategy offers strong profit potential, reinforcing its effectiveness in trend-following strategies.

22. Descending Triangle Pattern
The Descending Triangle Pattern is a bearish chart pattern that signals a continuation of the downtrend after a period of consolidation. Descending Triangle Pattern forms when price action creates lower highs while repeatedly testing a horizontal support level, indicating growing selling pressure and weakening buying interest.
The pattern develops as sellers push prices downward, forming a declining trendline, while buyers attempt to defend a key support level. A breakdown of support confirms a breakdown leading to a downward move. Traders measure the triangle’s height to estimate the next price target.
A key advantage of the pattern is its high probability of success in strong downtrends, making it one of the profitable chart patterns when executed correctly. It provides a structured approach to risk management, with short positions entered on a confirmed breakdown and stop-loss orders placed above the recent lower highs. The Descending Triangle is applied in stocks, forex, and futures markets. The pattern is most effective when it aligns with an established downtrend, reinforcing bearish momentum.
Failed breakdowns lead to reversals even though they are bearish, turning the formation into bullish chart patterns if support holds and price moves higher. Traders must be cautious of false breakdowns, using additional indicators for confirmation. The Descending Triangle Pattern is not ranked among the most successful chart patterns, but it remains a valuable tool for identifying short-selling opportunities. Its structured formation provides precise trade setups, making it a reliable choice for bearish trend traders.

23. Symmetrical Triangle Pattern
The Symmetrical Triangle Pattern is a neutral chart pattern that forms as price action contracts between higher lows and lower highs, creating a convergence point. Symmetrical Triangle Patterns reflect market indecision, where neither buyers nor sellers dominate, and the breakout direction determines whether they act as bullish chart patterns or bearish chart patterns.
The pattern develops during consolidation, with price movement narrowing within two trendlines. A breakout above resistance confirms a bullish move, while a breakdown below support signals bearish momentum. Traders project the pattern’s height at its widest point to estimate the potential price move after the breakout.
The formation’s flexibility is a key advantage, offering clear entry points in either direction. Defined stop-loss placement enhances risk management, making it one of the profitable chart patterns when traded with proper confirmation.
Symmetrical Triangles gain reliability when the breakout aligns with the prevailing trend. The Symmetrical Triangle pattern does not consistently rank among the most successful chart patterns, but it provides high-probability setups when breakouts occur with strong momentum. Proper execution and confirmation reduce the risk of false breakouts, improving its effectiveness in breakout trading strategies.

24. Wedge Pattern
The Wedge Pattern is a chart pattern that signals market consolidation before a breakout. Wedge Pattern forms when price action moves within two converging trendlines, creating a wedge-like shape. The pattern indicates either trend continuation or reversal, depending on the breakout direction.
There are two main types, the rising wedge, which leads to a bearish chart pattern, and the falling wedge, associated with a bullish chart pattern. A breakout above the upper boundary suggests bullish momentum, while a breakdown below support indicates further downside.
One of its strengths is its predictive power, offering clear entry points and structured risk management with stop-loss placement at key levels. The Wedge pattern is not among the most successful chart patterns, but it remains profitable when executed correctly.
The Wedge Pattern is used in stocks, forex, and futures. The RSI or MACD are used to confirm forex trades, where volume confirmation is less effective. Its reliability improves when aligned with existing market trends, proving the Wedge Pattern among the most profitable chart patterns.
The pattern’s effectiveness depends on proper breakout validation, as false signals lead to misjudged trades. Ensuring confirmation before entering positions enhances its accuracy in predicting price movements.
25. Rising Wedge Pattern
The Rising Wedge Patterns are bearish chart patterns that signal a potential reversal after a period of upward price movement. Rising Wedge Patterns form when price action creates higher highs and higher lows, but the range narrows as both trendlines converge. The structure indicates weakening bullish momentum and growing selling pressure.
Buyers struggle to push prices higher as the pattern develops, while sellers gradually gain control. A confirmed breakdown occurs when price moves below the lower boundary of the wedge, leading to a sharp decline. Traders estimate the potential price drop by measuring the wedge’s height and projecting it downward from the breakout point.
An advantage of the formation is its predictive power, providing clear entry points and well-defined stop-loss levels above recent highs. It ranks among the profitable chart patterns when adequately executed, allowing traders to capitalize on trend reversals.
The Rising Wedge Pattern is applied in stocks, forex, and futures markets. Forex traders rely on momentum indicators such as RSI and MACD to validate breakdowns. The pattern is most reliable when it appears after a strong uptrend, signaling exhaustion in buying pressure.
A temporary consolidation occurs within bullish chart patterns before an uptrend resumes. Breakdowns from the formation result in a bearish continuation. The Rising Wedge pattern is valuable for identifying bearish patterns, even though it isn’t classified as one of the most successful chart patterns. Proper risk management and confirmation strategies improve trade execution, making it a key reversal signal for traders.

26. Falling Wedge Pattern
The Falling Wedge Pattern is a bullish chart pattern that signals a potential trend reversal following declining prices. Falling Wedge Pattern forms as price action contracts between lower highs and lower lows, creating a narrowing structure that suggests weakening selling pressure. An upward movement is expected once the price breaks above the upper boundary.
The pattern develops as sellers gradually lose momentum while buyers start gaining control. A confirmed breakout occurs when price moves decisively beyond resistance leading to a strong rally. Traders estimate the potential price target by measuring the wedge’s height and applying it from the breakout point.
One of its key advantages is its predictive accuracy, ranking among the most successful chart patterns for reversals. It provides clear entry points and structured risk management, allowing stop-loss placement below recent lows. The chart pattern produces strong upside moves when executed with proper confirmation, which makes it one of the most profitable chart patterns.
The Falling Wedge is used in stocks, forex, and futures. Forex traders validate breakouts using momentum indicators, such as MACD or RSI. Its reliability increases when forming after a prolonged downtrend, as it marks a shift in market sentiment. The Falling Wedge pattern is bullish, but failed breakouts result in temporary price weakness, mimicking bearish chart patterns if support fails. Confirming signals with additional technical indicators enhances trade accuracy and reduces false breakouts. Proper execution ensures traders capitalize on trend reversals while maintaining controlled risk exposure.

27. Diamond Pattern
The Diamond Pattern is a chart pattern that forms when price action expands into a broadening structure and contracts, creating a diamond-like shape. Diamond Pattern signals potential trend reversals or continuations depending on the breakout direction. The pattern develops through a series of higher highs and lower lows, followed by a narrowing price range.
Diamond pattern emerges during periods of market indecision, where neither buyers nor sellers dominate. The breakout direction determines whether they behave as bullish chart patterns or bearish chart patterns. A breakout above resistance suggests upward momentum, while a breakdown below support indicates a potential decline. There are two main types, the Diamond Top, which leads to a bearish chart pattern, and the Diamond Bottom, associated with a bullish chart pattern.
Predictive accuracy is one of its key advantages, providing well-defined entry points and stop-loss levels. The pattern is not among the most successful chart patterns due to its rarity, but they remain profitable chart patterns when traded correctly.
The Diamond Pattern appears in stocks, forex, and futures markets. A breakout’s price direction is validated by increased trading activity during breakouts since volume confirmation is crucial in confirming the price direction. The RSI or MACD are used to confirm forex trades, where volume confirmation is less effective. Its reliability varies based on market conditions and external factors influencing sentiment.
Trade signals based on the Diamond Pattern are highly reliable when breakout confirmation is strong. An effective risk management strategy improves trade execution and helps identify market shifts.
28. Diamond Top Pattern
The Diamond Top Pattern is a bearish pattern that signals a potential reversal following an uptrend. Diamond Top Pattern forms as price action initially expands, creating higher highs and lower lows, followed by a contraction into a symmetrical narrowing, forming a diamond-like shape. The structure indicates increasing market uncertainty before a shift in direction.
The pattern results in a breakdown below support as buyers weaken and sellers gain control, resulting in a sharp decline. Traders estimate downside targets by measuring the diamond’s height and projecting it downward from the breakout point. False breakdowns occur despite its reliability in bearish scenarios, so confirmation through technical indicators is a must.
One of its strengths is its predictive accuracy, offering clear entry points and structured risk management with stop-loss placement above recent highs. Diamond Patterns remain profitable chart patterns when executed correctly, even though they are not among the most successful chart patterns due to their rarity. The pattern is used in stocks, forex, and futures. The increased activity during breakouts enhances reliability since volume confirmation is enhanced during breakouts.
The Diamond Top Pattern sometimes transitions into bullish chart patterns if price breaks upward instead of downward, even though it is primarily bearish chart patterns, signaling continued market strength. Traders capitalize on bearish and bullish breakout scenarios with proper execution and confirmation, turning Diamond Top Pattern a valuable tool in market analysis.

29. Diamond Bottom Pattern
The Diamond Bottom Pattern is a bullish pattern that signals a reversal from a downtrend. Diamond Bottom Pattern forms when price action initially broadens with lower lows and higher highs, followed by a contraction into a narrowing structure, forming a diamond shape. The shift in volatility indicates a transition from selling pressure to growing buying momentum.
A bullish breakout is confirmed when price moves above the upper boundary, leading to a strong rally. Traders measure the pattern’s height to estimate potential upside targets. Volume confirmation and the use of indicators of the moment, such as MacD or RSI, strengthens reliability, as increased trading activity during the breakout reinforces the shift in market sentiment.
The pattern provides clear entry points and defined stop-loss levels below recent lows, rendering it practical for risk management. The Diamond Bottom Patterns are profitable chart patterns when executed correctly in markets like stocks, forex, and futures, although they are not among the most successful chart patterns.
Failed breakouts lead to continued declines even if they are primarily bullish chart patterns, temporarily resembling bearish chart patterns before a confirmed reversal. Traders must verify breakouts with technical indicators to minimize false signals. Proper confirmation ensures better trade execution and stronger market positioning.

30. Megaphone Pattern
The Megaphone Pattern, known as the Expanding Triangle or Broadening Formation Pattern, is characterized by higher highs and lower lows, forming diverging trendlines. Megaphone Pattern reflects increasing volatility and market uncertainty preceding a breakout in either direction.
The pattern develops as buyers and sellers push prices to new extremes, expanding the range. Confirmed breakouts determine whether they act as bullish chart patterns if the price moves above resistance, or bearish chart patterns if the price breaks below support. Traders typically enter positions after a breakout, using stop-losses near recent highs or lows for risk management.
An advantage of the Megaphone Pattern is its ability to highlight strong price movements. The pattern is applicable across stocks, forex, and futures markets, with broadening bottoms having a higher reliability rate (75%) compared to broadening tops (65%), according to Thomas Bulkowski. The pattern is most reliable on higher timeframes, where market sentiment is more defined.
The pattern is classified as a reversal pattern, but functions as a continuation pattern sometimes, depending on the market context. Megaphone Patterns are not the most successful chart patterns, as its structure is unpredictable, but they remain profitable chart patterns if they are traded with proper breakout confirmation and technical indicators like ATR or Bollinger Bands to validate volatility expansion.

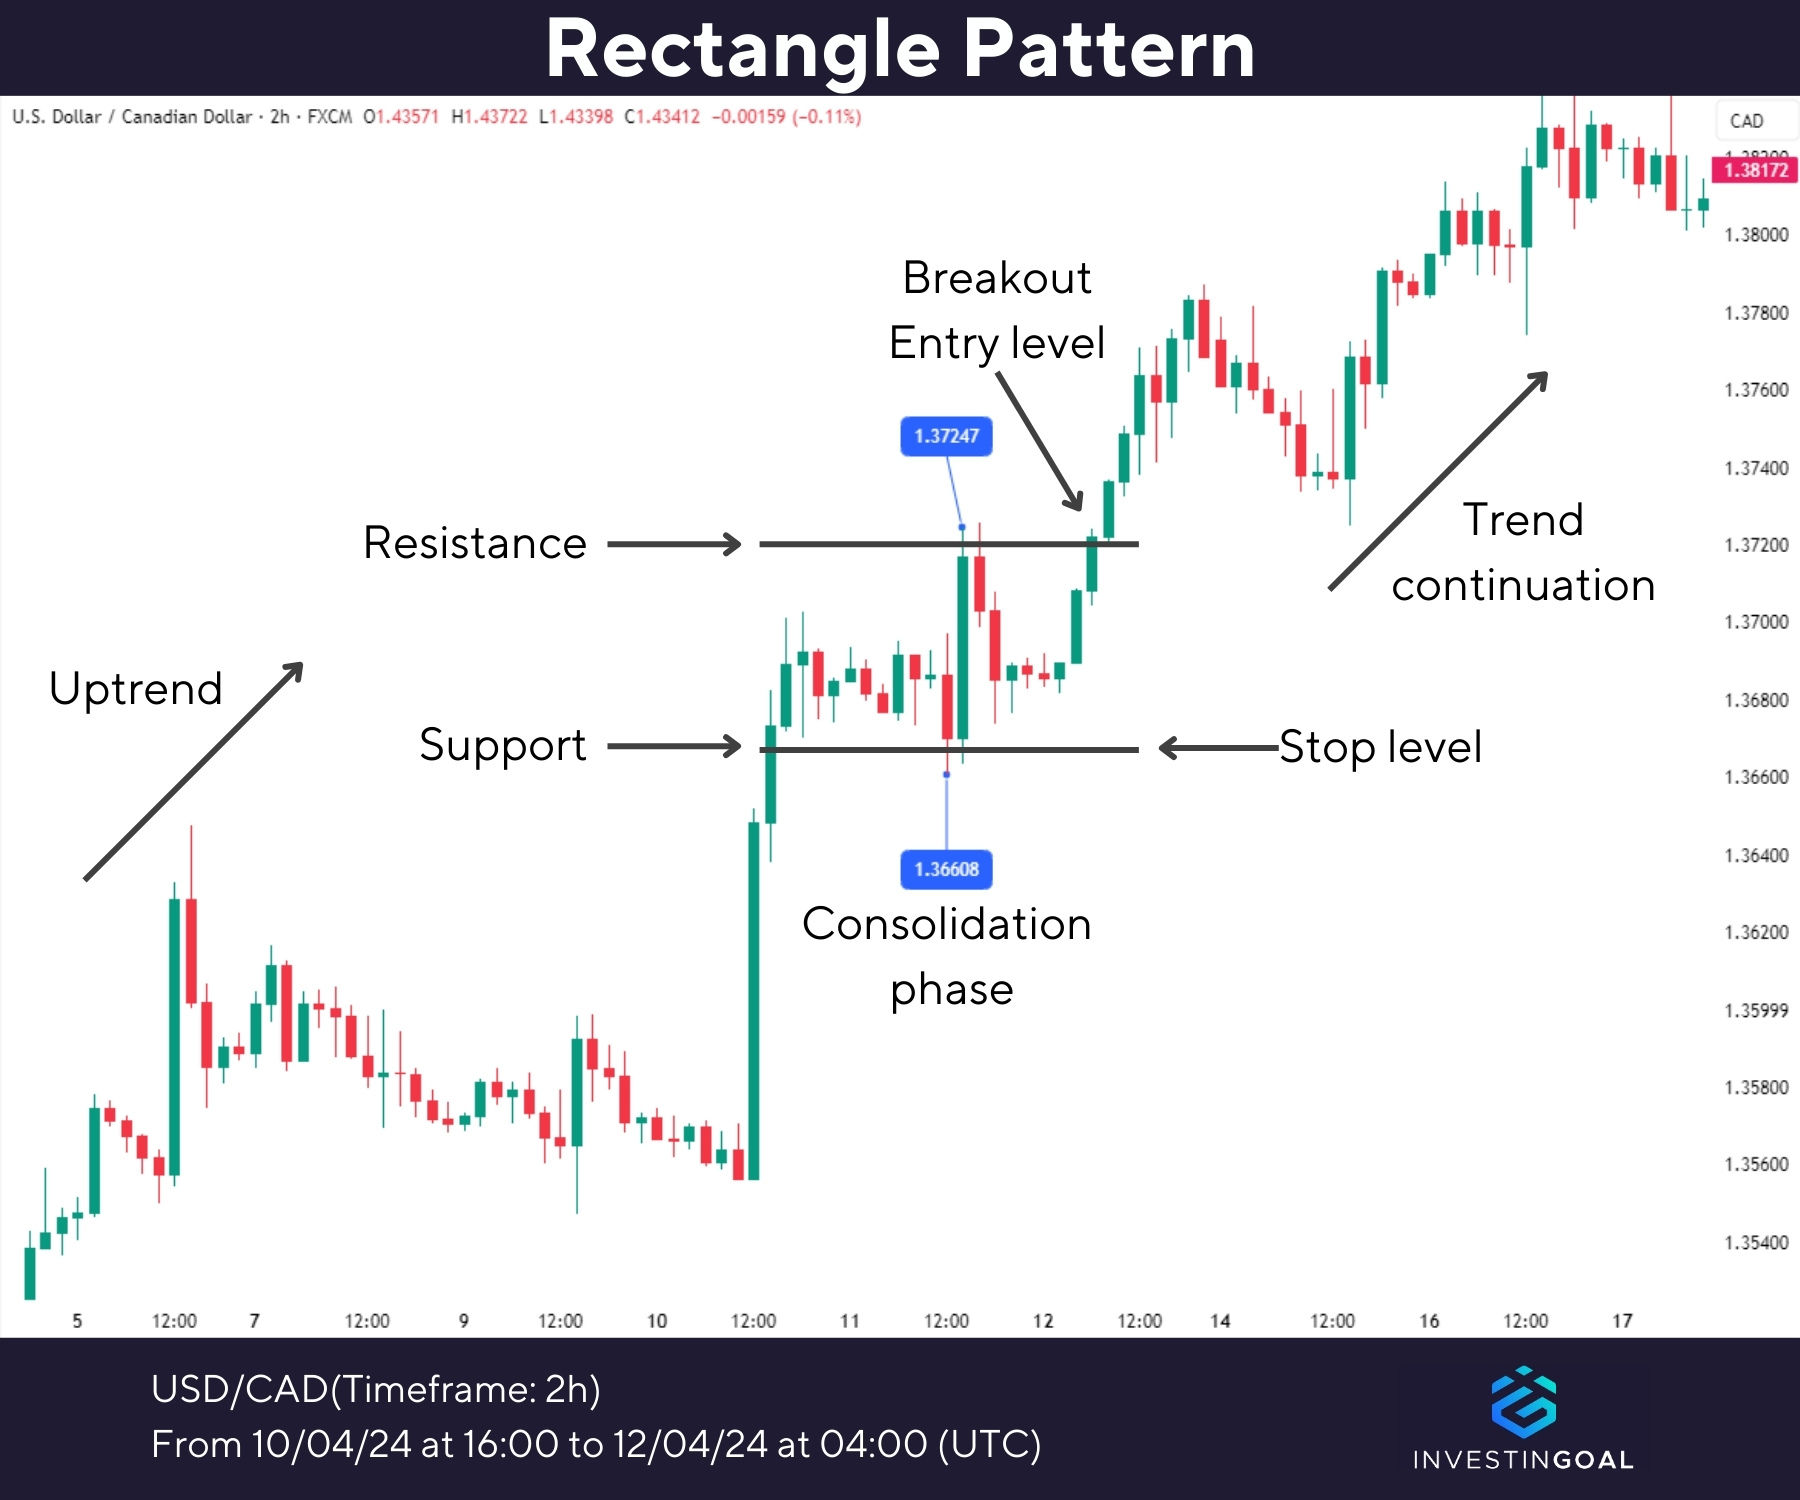
31. Rectangle Pattern
The Rectangle Pattern forms when price moves within a horizontal range, bouncing between parallel support and resistance levels. The structure reflects a period of consolidation, where neither buyers nor sellers dominate, leading to a temporary pause in the trend. The breakout direction determines whether it functions as a bullish or bearish chart pattern.
Bullish chart patterns occur when the price breaks above the upper resistance level of the rectangle, signaling a continuation of the previous uptrend. The breakout accompanies increased volume, confirming the move’s strength. Bearish chart patterns form when price breaks below the lower support level, indicating that sellers have gained control and the downtrend is likely to continue. The breakdown is reinforced by higher selling volume, strengthening the bearish momentum.
The Rectangle pattern signals a balance between supply and demand until a breakout occurs. Price repeatedly tests support and resistance before a decisive move. A breakout above resistance confirms a bullish continuation, while a breakdown below support indicates a bearish continuation. Traders use volume confirmation to validate the breakout, ensuring stronger reliability.
One key advantage of Rectangle Pattern is its predictive value, as it provides clear entry points and defined risk management by setting stop-losses near the range’s boundaries and a profit at least equal to the height of the triangle. It applies across stocks, forex, and futures, making it a versatile tool for different market conditions.
The Rectangle Pattern is reliable when it forms within a strong trend. They remain profitable chart patterns even though they aren’t the most successful chart pattern, as long as they execute it correctly. Proper confirmation through technical indicators reduces false breakouts, enhancing its effectiveness.
32. Rounding Bottom Pattern
The Rounding Bottom Pattern, known as the Saucer Bottom, is a bullish chart pattern that signals a gradual shift from a downtrend to an uptrend. Rounding Bottom Pattern forms a U-shaped curve, transitioning from selling pressure to growing buying interest. The pattern appears over extended timeframes, which makes it useful for long-term analysis.
The pattern develops in three phases, a gradual decline, a stabilization period, and a steady upward movement. Confirmation occurs when the price breaks above the neckline, accompanied by rising trading volume, signaling strong buyer momentum. A successful breakout provides a clear entry point, while stop-losses are placed below recent lows for risk management and a target equal to the size of the pattern. The pattern is applied to stocks, forex, and futures, and is moderately reliable, mainly when supported by volume confirmation and other technical indicators. The pattern’s effectiveness increases in strong market trends, despite its slow formation.
Bullish chart patterns are confirmed when price breaks above the neckline with strong volume, indicating a potential long-term uptrend. Bearish chart patterns are the opposite structure, where price forms an inverted U-shape, signaling a transition from bullish momentum to a downtrend. A Rounding Bottom Pattern is not among the most successful chart patterns widely recognized for its ability to signal strong reversals. False breakouts occur, requiring additional confirmation before entering a trade. They are profitable chart patterns when traded with proper breakout confirmation and risk management strategies.

33. Rounding Top Pattern
The Rounding Top Pattern is a bearish chart pattern that signals a gradual shift from an uptrend to a downtrend. Rounding Top Pattern forms a U-shaped curve flipped upside down, indicating a slow transition from strong buying momentum to increasing selling pressure. The pattern appears after a prolonged uptrend, suggesting a weakening bullish market before a reversal occurs.
The formation develops over three phases, an initial price increase, a gradual leveling-off period, and a steady downward movement. The pattern confirms a bearish breakout when the price moves below the neckline, the lowest point before the rounded top. Increased trading volume at the breakdown strengthens the confirmation, signaling a higher probability of continued decline. A bullish chart pattern emerges only if the price fails to break downward and regains strength, pushing higher. It is uncommon though, as the Rounding Top Pattern favors bearish outcomes.
One of its key advantages is its predictive strength, allowing traders to anticipate market reversals. It provides clear entry points for short trades and well-defined stop-loss placement above recent highs. Stocks, forex, and futures all benefit from the Rounding Top Pattern, proving it useful across multiple financial markets. The pattern is not among the most successful chart patterns, as its slow formation leads to false signals. It remains a profitable chart pattern when confirmed by volume and other indicators, offering high-reward opportunities for traders who execute trades with proper risk management.

34. Island Reversal Pattern
The Island Reversal Pattern signals a sudden shift in market sentiment, leading to a trend reversal. Island Reversal Pattern forms when a group of price bars or candlesticks is isolated by two gaps, creating an “island” on the chart. The pattern indicates bullish chart patterns when it appears after a downtrend, or bearish chart patterns when it forms at the peak of an uptrend.
The pattern develops in three phases. The first gap occurs in the direction of the prevailing trend, followed by a consolidation phase, where price movements remain confined within a limited range. The second gap, which moves in the opposite direction, confirms the reversal and establishes the new trend. A successful breakout accompanies high trading volume, strengthening the pattern’s validity.
The main advantage of the method is its predictive power, as it provides a clear entry point when the second gap forms. The pattern allows for risk management, as stop-loss levels are placed at the recent high or low. Markets with frequent price gaps are likely to experience the Island Reversal Pattern, which is found in stocks, forex, and futures.
The Island Reversal Pattern is considered one of the most successful chart patterns, as its formation depends on gap occurrences, which are less frequent in continuous markets like forex. Island Reversal patterns remain profitable chart patterns when traded correctly, as confirmed breakouts lead to substantial price movements. Traders improve reliability by analyzing volume trends and market conditions, ensuring better trade execution.

35. Dead Cat Bounce Pattern
The Dead Cat Bounce Patterns are bearish chart patterns that signal a temporary recovery in a downtrend before prices resume falling. Dead Cat Bounce Patterns appear after a notable decline, where a short-lived price rally misleads traders into thinking a reversal is occurring. The pattern results from short covering or speculative buying but fails to sustain momentum. Bullish chart patterns form when an asset consistently makes higher highs and higher lows, signaling upward momentum.
The pattern lures traders into believing that the downtrend has ended, only for selling pressure to return. The brief rally is followed by a sharp decline, confirming the continuation of the previous trend. Volume analysis identifies the pattern, as the bounce occurs on low volume, while the resumption of the downtrend is confirmed by high selling volume.
A key advantage of its predictive ability is that it provides clear entry points for traders seeking to initiate short positions. Risk management opportunities exist with Dead Cat Bounce Pattern, where stop-loss levels are placed at the recent high of the bounce to minimize losses. The Dead Cat Bounce Pattern is applicable in stocks, forex, and futures markets, though it is more common in volatile assets. Its reliability is moderate, as it is challenging to identify in real-time and is confirmed only in hindsight. Traders gain more insight into Dead Cat Bounce pattern when used with other technical indicators.
The Dead Cat Bounce Pattern is not included among the most successful chart patterns because of its difficulty in real-time identification and reliance on hindsight for confirmation. It remains in the list of most profitable chart patterns when traders correctly anticipate the continuation of the downtrend and manage risk effectively.

36. Measured Move Up Pattern
The Measured Move Up Pattern is a continuation formation that signals a sustained upward movement in financial markets. An initial price surge, a consolidation phase, and a second upward leg comprise a Measured Move Up Pattern. The initial upward movement of the pattern helps traders estimate the next price target.
Measured Move Up Pattern identifies a strong price increase followed by a period of stabilization, where traders take profits or adjust positions. The breakout from consolidation mirrors the first move in size and momentum, confirming the continuation of the uptrend. Increased trading volume during the breakout strengthens the pattern’s reliability.
The Measured Move Up Pattern is a structured approach to predicting trend continuation, a significant advantage of the pattern. The pattern provides clear entry points when the price breaks out of consolidation and offers defined stop-loss levels at recent pullback lows, reducing risk. The pattern applies to stocks, forex, and futures markets in strong trends. It has a moderate to high success rate when technical indicators such as support levels and moving averages confirm it.
Bullish chart patterns like the Measured Move Up indicate a continuation of an uptrend, making it a favorable setup for long trades. Bearish chart patterns are not associated with the formation, as it does not signal market reversals. Measured Move Up Pattern is not considered among the most successful chart patterns but is widely used due to its structured predictability. The Measured Move Up Pattern is regarded as one of the profitable chart patterns, providing traders with a clear strategy for entry and risk management in trending markets.

37. Bump and Run Reversal Pattern
The Bump and Run Reversal Pattern is a technical chart formation that signals a trend reversal, after an aggressive speculative price surge. The pattern consists of three distinct phases, the lead-in, where prices rise steadily, the bump, where prices spike sharply, and the run, where prices drop back to the lead-in trendline and continue downward. It is seen after excessive speculation leads to unsustainable price increases, followed by a reversal.
The pattern functions as a signal of a market sentiment shift from bullish to bearish. The lead-in phase represents steady growth, while a rapid, unsustainable price increase characterizes the bump phase. The run phase starts when prices decline to the trendline, breaking below it and confirming the reversal. A substantial increase in volume during the decline enhances the pattern’s reliability.
An advantage of the pattern is its ability to provide clear entry points during the run phase when the trend reversal is confirmed. It offers effective risk management, as stop-loss levels are above the recent high. The pattern is further validated by volume confirmation, as increasing volume during the breakdown reinforces the likelihood of a sustained reversal.
The pattern is applicable in stocks and forex markets, across multiple timeframes, including daily, weekly, and monthly charts. Market corrections are identified using the Bump and Run Reversal Pattern following speculative price surges. The Bump and Run Reversal Pattern is classified as a bearish chart pattern, signaling a shift from upward momentum to a downtrend. The pattern does not align with bullish chart patterns, as it does not indicate a continuation or initiation of an uptrend.
The Bump and Run Reversal is not regarded as one of the most successful chart patterns due to its reliance on specific conditions, such as an unsustainable price spike. The chart pattern is considered one of the most profitable chart patterns because it provides traders with a structured approach for identifying and capitalizing on trend reversals when properly executed.

38. Flagpole Pattern
The Flagpole Pattern is a technical formation representing the initial strong price movement before a consolidation phase. Flagpole Pattern is a crucial component of the Flag Pattern, where the flagpole signifies the dominant trend before the market pauses. The pattern appears bullish and bearish, depending on the direction of the price movement.
A bullish chart pattern with a flagpole forms when the price surges sharply upward, followed by a sideways movement before continuing the uptrend. A bearish chart pattern with a flagpole develops after a steep price decline, leading to a brief consolidation before the trend resumes downward.
The pattern identifies a strong initial movement, known as the flagpole, which is followed by a brief pause where prices move within a narrow range. It continues in the same direction as the flagpole, once the price breaks out of the consolidation zone. Traders use the flagpole length to estimate potential price targets, helping them set profit-taking and stop-loss points.
Trending markets, including stocks, forex, and futures, follow Flagpole Pattern. It is considered reliable when confirmed by volume analysis, where high volume during the flagpole phase indicates strong participation, reinforcing the likelihood of continuation.
The Flagpole Pattern contributes to identifying profitable chart patterns when combined with other technical indicators. The trend continuation pattern is not one of the most successful chart patterns, but it remains essential in technical analysis, helping traders predict trend continuation with greater confidence.

39. Parabolic Curve Pattern
The Parabolic Curve Pattern is a technical chart formation that occurs when an asset experiences a rapid and exponential price increase, forming a steep upward curve. The pattern typically emerges in highly speculative markets, where excessive buying leads to unsustainable price movements. The final phase of the pattern often results in a sharp decline as the market corrects itself.
The pattern represents bullish and bearish patterns at different stages. The initial parabolic rise is a bullish chart pattern, indicating strong momentum and high investor enthusiasm. The pattern transitions into a bearish chart pattern, once the price reaches an extreme level and begins to break down, suggesting a potential reversal.
The Parabolic Curve Pattern progresses through three key phases: a steady price increase, an acceleration phase where price surges rapidly, and an exhaustion phase where buying momentum weakens. A breakdown below the lower trendline of the curve confirms the pattern, leading to significant declines. Traders look for volume confirmation, as decreasing volume during the final phase strengthens the likelihood of a reversal.
The pattern is observed in stocks, forex, and cryptocurrencies, where speculative trading drives extreme price swings. Timing the breakdown is challenging since the Parabolic Curve Pattern rises sharply. It provides strong trading signals when combined with other technical indicators.
The Parabolic Curve Pattern is not considered one of the most successful chart patterns due to its unpredictability and rarity. It remains one of the profitable chart patterns when correctly identified and executed, as the potential gains from shorting the breakdown are significant. Proper risk management is essential, as the pattern remains in an extended uptrend before reversing.

40. Rising Channel Pattern
The Rising Channel Pattern, known as the Channel Up Pattern or the Ascending Channel Pattern, is a technical chart formation representing a steady uptrend. Rising Channel Pattern is formed by two parallel upward-sloping trend lines that contain price action within a structured range. The pattern indicates a market in which buyers are in control, consistently pushing prices higher while establishing higher highs and higher lows.
Rising Channel patterns are classified as bullish chart patterns because they signify an ongoing uptrend. The price fluctuates between the upper resistance and lower support lines, allowing traders to enter long positions near support and exit near resistance. A breakdown below the lower trend line indicates a trend reversal, transitioning it into bearish chart patterns.
The pattern structure allows traders to predict price behavior based on the existing trend. Buying near support and selling near resistance are common strategies, with stop-loss levels placed just below the lower trend line to manage risk. It signals trend acceleration if the price breaks above the upper resistance line, while a breakdown below the support suggests a reversal. High trading volume during a breakout increases confidence in the pattern’s validity.
The pattern is applied in various markets, including stocks, forex, commodities, and futures, and is effective across multiple timeframes. Its reliability depends on market conditions and confirmation from technical indicators such as volume and momentum oscillators.
The pattern is not regarded as one of the most successful chart patterns, but the Rising Channel Pattern is highly effective in strong uptrends when used with proper risk management. The patterns are considered profitable chart patterns because they provide precise entry and exit points, allowing traders to take advantage of well-defined trends. Risk management strategies such as stop-loss placement and volume confirmation are essential since trends break unexpectedly.

41. Falling Channel Pattern
The Falling Channel Pattern, known as the Channel Down or the Descending Channel, is a technical analysis formation representing a sustained downtrend. Falling Channel Pattern consists of two parallel downward-sloping trend lines that contain price movements within a defined range. The pattern signals that sellers are in control, consistently driving prices lower while establishing lower highs and lower lows.
The patterns are considered bearish chart patterns because they indicate a downward trend. Traders look for short-selling opportunities near the upper resistance line, expecting the price to decline further. The breakout of the upper boundary with strong momentum indicates a potential trend reversal, resulting in bullish chart patterns.
The pattern functions by providing precise levels for trading decisions. The price fluctuates between the channel boundaries, allowing traders to set entry and exit points. Short positions are initiated near resistance, while potential buy signals emerge if the price breaks above resistance, signaling a trend reversal. Increased trading volume during breakouts strengthens the pattern’s reliability.
The Falling Channel Pattern is used in stocks, forex, commodities, and futures, which makes it versatile across different timeframes. Confirming signals using additional indicators such as moving averages or momentum oscillators is essential even though it is effective in trending markets.
The pattern is not considered one of the most successful chart patterns, as false breakouts occur and require careful analysis. The Falling Channel Pattern is regarded as one of the profitable chart patterns when traded correctly. Managing risk through stop-loss placement and confirmation with technical indicators enhances its effectiveness in capturing downside momentum.

42. Volatility Contraction Pattern
The Volatility Contraction Pattern (VCP) is a technical analysis formation that signals the buildup of buying pressure before a potential breakout. Mark Minervini develops the pattern of progressively smaller price swings, indicating reduced volatility and declining selling pressure. It forms within a consolidation phase and is often accompanied by decreasing volume, suggesting that buyers are gaining control.
Volatility Contraction pattern is a bullish chart pattern and assists traders in recognizing stocks or assets positioned for substantial upward movements. The narrowing price range reflects increasing demand, and once the price breaks above a key resistance level with considerable volume, it leads to a strong rally. The pattern signals bullish opportunities, but a failed breakout leads to a downward movement, temporarily transforming it into bearish chart patterns. Traders use stop-losses below the most recent low to minimize risk and reassess market conditions.
The pattern applies to stocks, forex, and commodities in breakout trading strategies. It is considered highly reliable when confirmed by increasing volume and other technical indicators such as moving averages or relative strength. Traders specializing in breakout setups find the Volatility Contraction Pattern an invaluable tool, though not classified as one of the most successful chart patterns. It is one of the profitable chart patterns if used correctly, offering traders well-defined risk-to-reward ratios and precise entry points.

43. Descending Scallop Pattern
The Descending Scallop Pattern is a technical analysis formation that appears during a downtrend, characterized by a sharp decline, a brief upward pullback, and another drop, forming an inverted “J” shape. The pattern signals bearish momentum, suggesting the continuation of the existing downtrend rather than a reversal.
Bearish chart patterns reflect a market dominated by selling pressure, causing prices to decline further after a temporary retracement. Traders use the pattern to identify shorting opportunities, entering positions after the price breaks below the previous low. The pattern forms in a consolidating market, resulting in a failed breakdown. They temporarily act as bullish chart patterns if buyers regain control, but they are less common. Traders rely on volume confirmation to determine trend strength.
The pattern applies to stocks, forex, and cryptocurrency markets in environments where short selling is feasible. It is considered moderately reliable, forms a breakout in 78% of cases, according to Thomas Bulkowski, and tends to retest support levels before continuing downward. Volume analysis is crucial in confirming whether a breakdown is genuine in Descending Scallop Pattern.
The Descending Scallop Pattern is not among the most successful chart patterns, as its effectiveness depends on market conditions and confirmation signals. It remains one of the profitable chart patterns for traders who use it alongside other technical indicators to validate trade entries and manage risk efficiently.

44. Ascending Scallop Pattern
The Ascending Scallop Pattern is a continuation chart formation that resembles a “J” shape and appears within an uptrend. Ascending Scallop Pattern signifies a brief consolidation phase followed by a breakout, demonstrating increasing buying pressure. The price initially rises, experiences a shallow pullback, and resumes its upward trajectory, forming a curved structure on the chart.
The Ascending Scallop Pattern is used in technical analysis to anticipate the continuation of an uptrend. The pattern forms as buyers regain control after a minor retracement, increasing prices. Traders use it to identify breakout opportunities and determine optimal entry points within a strong bullish market. The pattern begins with an upward price move, followed by a gradual pullback that forms a rounded bottom. The price stabilizes and surges past resistance levels as selling pressure diminishes. A breakout accompanied by rising volume strengthens the bullish confirmation. Traders enter long positions upon breakout, placing stop-loss orders below the recent low to manage risk.
The Ascending Scallop Pattern is used in stocks, forex, and cryptocurrency markets. The pattern is effective in trending conditions where price action moves steadily upward. The reliability of the pattern depends on market conditions, with confirmation through volume and momentum indicators enhancing its effectiveness. They are classified as bullish chart patterns that reinforce the continuation of an existing uptrend. A confirmed breakout above resistance indicates that buyers are in control, increasing the probability of further price appreciation.
The pattern is not considered one of the most successful chart patterns, but it remains valid for traders following trend continuation strategies. The pattern is one of the profitable chart patterns that offers favorable risk-reward opportunities when executed correctly. The Ascending Scallop Pattern confirms sustained buying interest, supporting a continuation of bullish momentum unlike bearish chart patterns, which signal selling pressure and potential downtrends.

45. Butterfly Chart Pattern
The Butterfly Chart Pattern is a harmonic reversal pattern that helps traders identify potential turning points in the market. The Butterfly Chart Pattern includes four price components (XA, AB, BC, and CD) to create a structure that looks like a butterfly. The key to the pattern is its reliance on Fibonacci retracement and extension levels, which help determine potential reversal zones.
The pattern is used in technical analysis to anticipate trend reversals. Traders apply Fibonacci ratios to measure each leg of the pattern, identifying areas where the price is likely to change direction. Completing the CD leg at a specific Fibonacci extension level (161.8% to 224% of BC) marks the reversal point.
The pattern begins with the XA leg, a firm price movement in one direction. The AB leg retraces around 78.6% of XA, followed by the BC leg, which moves in the opposite direction of AB. The final CD leg extends beyond the XA leg, reaching a Fibonacci extension level where a reversal is expected, point D. Traders wait for confirmation before entering trades.
Butterfly Chart Pattern is applicable in forex, stocks, and futures markets in environments where Fibonacci-based trading strategies are effective. Advanced traders use it, since it relies on precise measurements. The patterns are classified as bearish chart patterns when they form at market tops, signaling a downward reversal. The patterns are deemed bullish chart patterns when they appear at market bottoms, suggesting a potential price increase.
Traders highly value the Butterfly chart patterns for their accuracy in spotting reversal points, although they aren’t the most successful chart patterns. The pattern is one of the profitable chart patterns, and when applied correctly, it provides well-defined risk-reward setups. Its effectiveness depends on accurate Fibonacci analysis and confirmation signals.

How do Chart Patterns vary across Forex, Stock, and Crypto Markets?
Chart patterns vary across forex, stock, and crypto markets due to differences in volatility, liquidity, and influencing factors. Each market reacts to distinct external events, which shape how patterns form and behave. Chart patterns in forex, stock, and crypto markets differ due to volatility, liquidity, and market sentiment. A forex market benefits from deep liquidity and controlled volatility, but crypto markets suffer from speculative trading, while macroeconomic factors and company-specific events impact stock markets. Each market requires distinct approaches to analyzing chart patterns, with forex patterns being more stable, crypto patterns being fast-changing, and stock patterns aligning with scheduled events and company performance.
Forex chart patterns remain stable and reliable due to high liquidity and macroeconomic factors. Central bank policies and economic events like GDP reports and interest rate decisions heavily influence forex prices. Liquidity in major pairs helps avoid false breakouts, but patterns in less liquid minor and exotic pairs are less reliable. Forex market hours are segmented into trading sessions, and chart patterns shift based on these changes in liquidity. Using different timeframes in forex allows traders to adjust strategies according to the prevailing market conditions, with patterns forming more consistently on longer timeframes.
The crypto market, influenced by crypto chart patterns, is characterized by extreme volatility driven by speculative trading and regulatory uncertainty. Liquidity is lower than in the forex and stock markets, causing sharper breakouts and unreliable signals for smaller altcoins. Crypto markets react to sudden news events, social media trends, and regulatory updates, which cause rapid price changes. Crypto markets operate 24/7, requiring traders to monitor chart patterns constantly and react swiftly. The unpredictability of market sentiment in crypto is driven by retail traders, making chart patterns shift unexpectedly.
The stock market, influenced by stock chart patterns, forms chart patterns around scheduled events like earnings reports and product launches. Liquidity is more substantial for large-cap stocks, ensuring more reliable patterns, while small-cap stocks experience less predictable movements. Company fundamentals and sector news influence stock chart patterns, and the market’s behavior around these events is more predictable. Overnight gaps disrupt patterns as stock markets operate within fixed trading hours. Stock traders use longer timeframes, focusing on broader trends and long-term movements, and the sentiment in the stock market is shaped by institutional activity and macroeconomic conditions.
To trade Forex using Chart Patterns, follow the instructions listed below.
- Learn to recognize various forex chart patterns, such as head and shoulders, double tops, and triangles. The patterns help predict potential price movements and reversals in the market.
- Pay attention to economic calendar events like interest rate decisions and GDP reports. Forex chart patterns align with these events as prices react to macroeconomic data and central bank policies.
- Recognize shifts in market sentiment, which cause forex patterns to break or reverse. It is critical as sentiment is influenced by institutional traders and central bank policies, affecting the reliability of the patterns.
- Adapt strategy to different timeframes. Forex trading chart patterns form differently on short-term versus long-term charts. Short-term traders focus on intraday patterns, while long-term traders analyze broader trends.
- A forex chart pattern sometimes leads to a false breakout in pairs with low liquidity. Confirm breakouts using other technical indicators to avoid misinterpreting signals.
- Take advantage of high liquidity during specific forex market sessions, such as the London or New York session. It increases the reliability of forex patterns and reduces the impact of volatility seen during off-peak hours.
- Combine forex trading chart patterns with technical indicators like moving averages or RSI to increase the accuracy of trades. Indicators provide confirmation and help refine entry and exit points.
- Use stop-loss orders and position-sizing strategies. Risk management is vital to protect capital, even with the most reliable forex patterns.
- Be aware that liquidity in forex patterns is higher in major currency pairs, such as EUR/USD, and lower in exotic pairs. It affects the stability and reliability of chart patterns.
- Stay flexible and adjust strategies as market conditions evolve. Forex chart patterns behave differently in trending versus consolidating markets, so be prepared to adapt your approach in Forex trading.
To trade stock using Chart Patterns, follow the instructions listed below.
- Learn to recognize common stock market chart patterns, such as head and shoulders, double tops, and triangles. The patterns help predict price movements in the stock market, signaling possible reversals or trend continuations.
- Chart patterns in stock market tend to form around scheduled events, like earnings reports or product launches. The events increase volatility, creating specific patterns traders use to predict future price actions.
- Pay attention to liquidity when evaluating stock market chart patterns. Large-cap stocks offer more reliable patterns, while smaller stocks with low liquidity present less predictable signals and more false breakouts.
- Chart patterns in the stock market align with predictable cycles, such as earnings reports or sector-specific news. Stock prices react to company fundamentals and macroeconomic factors, making these patterns valuable tools for anticipating price movements.
- Stock market chart patterns are more reliable around scheduled events, though they are disrupted by overnight gaps or after-hours news. The disruptions happen because stock prices react to new information, so patterns must be reassessed after such events.
- Chart patterns in the stock market develop over extended periods. Focus on longer timeframes for a better understanding of broader trends. Traders use these patterns to identify entry and exit points for long-term investments.
- Stock market chart patterns shift quickly based on changes in market sentiment. Macroeconomic trends and institutional activity influence sentiment and impact the reliability of patterns. Awareness of broader market conditions helps traders anticipate shifts in sentiment and adjust strategies accordingly.
- Traders use stock market chart patterns to determine optimal entry and exit points for Stock Trading. Patterns like triangles or double bottoms signal when a price is likely to break out, providing ideal opportunities for buying or selling.
To trade Crypto using Chart Patterns, follow the ten steps listed below.
- Familiarize with common crypto chart patterns such as head and shoulders, double tops, and triangles. The patterns help traders predict potential price movements and reversals in Crypto Trading.
- Crypto chart patterns are susceptible to volatility. Crypto markets experience rapid price fluctuations due to speculative trading, regulatory uncertainty, and market news from prominent leaders like Elon Musk, causing patterns to fail more frequently. Focus on times when volatility stabilizes to increase the reliability of chart patterns.
- Crypto chart patterns show sharper breakouts and are unreliable due to lower liquidity in smaller altcoins. Major cryptocurrencies like Bitcoin and Ethereum offer more reliable patterns, but lower liquidity results in unpredictable movements in smaller tokens.
- Crypto chart patterns break suddenly due to unexpected news or events, as crypto markets are highly responsive to innovations, adoption, regulations, and social media trends. Stay informed on these factors, as they dramatically alter market sentiment and affect the reliability of chart patterns.
- Crypto chart patterns form and evolve more quickly compared to other markets. Cryptocurrency price changes occur rapidly, so traders use shorter timeframes to react to chart pattern developments. Adjust trading strategies to take advantage of these faster-moving patterns.
- Crypto markets are prone to false breakouts due to high volatility. Crypto chart patterns give misleading signals during sudden price movements. Confirm breakouts with additional indicators or volume analysis to ensure the pattern is valid.
- Crypto chart patterns shift unpredictably due to sudden changes in market sentiment, influenced by retail traders or social media trends. Track the sentiment to anticipate changes in chart patterns and avoid false signals driven by emotional reactions from the market.
- Crypto markets operate 24/7 without closing hours, so crypto chart patterns emerge constantly and require constant monitoring. The absence of a closing period means traders must be ready to act on patterns at any time of the day or night, unlike traditional markets.
- Risk management is essential even with reliable crypto chart patterns. Crypto markets are unpredictable and volatile, so use stop-loss orders and manage position sizes carefully to protect capital from unexpected swings.
- Enhance the accuracy of Crypto Trading by combining crypto chart patterns with other technical indicators, such as RSI or moving averages. It helps confirm signals and improves decision-making when entering or exiting trades.
Chart patterns used in trading strategies are crucial in identifying potential market movements and trend reversals. The patterns provide traders with visual signals that help predict future price action, allowing for informed decision-making in Trading Strategies.
Chart patterns are essential in an effective trading strategy because of their ability to anticipate market behavior. Traders predict whether a price continues in the current direction by recognizing familiar patterns such as head and shoulders, triangles, or double tops or whether it reverses. The insight helps traders enter and exit positions more accurately, maximizing profit potential and minimizing losses.
Traders use these patterns to their advantage by applying them to different market conditions and timeframes. A pattern trading strategy involves identifying key patterns, confirming them with technical indicators or volume analysis, and taking action based on the signal. For example, traders buy when a bullish pattern is identified, while a bearish pattern prompts a sell or short position. Traders improve their chances of success and enhance the effectiveness of their Trading Strategies by combining chart patterns with risk management techniques.
The importance of chart patterns for traders and investors is because they deliver predictive insights that guide decision-making and trading strategy creation. Traders predict price movements by analyzing these patterns, which helps them determine if a market continues in its current direction or reverses. The predictive ability is a key aspect of chart patterns in technical analysis, offering valuable foresight in trading decisions.
Chart patterns are crucial for analyzing market sentiment. The patterns reflect the collective behavior of market participants, which allows traders to gauge sentiment. Understanding whether the market is bullish or bearish helps traders align their strategies with prevailing market conditions.
Chart patterns help in risk management. Recognizing specific patterns enables traders to set appropriate stop-loss levels, reducing potential losses if the market moves against their predictions. Using chart patterns, traders protect their capital and manage risk more effectively, keeping losses to acceptable limits. Chart patterns assist in identifying optimal entry and exit points for trades. Traders use patterns to time their market entries and exit more accurately, creating profits while minimizing losses.
Chart patterns are valuable for confirming the validity of a trend. Patterns that indicate continuation or reversal aid traders in reinforcing their confidence in a particular trade. It helps them avoid making impulsive decisions and instead act based on structured analysis.
The visual nature of chart patterns provides an easy way to interpret market behavior. Traders quickly assess price movements and identify potential trading opportunities without relying on complex indicators. The simplicity makes chart patterns a popular tool in technical analysis.
The versatility of chart patterns adds to their importance. Chart patterns are applied across various markets, including stocks, forex, commodities, and cryptocurrencies. The broad applicability makes chart patterns a universal tool for traders, regardless of the market they are involved in.
Chart patterns differ from candle stick patterns in technical analysis by their scope and time frame of analysis. Chart patterns, such as head and shoulders or triangles, develop over a more extended period and predict broader market trends and potential reversals or continuations. Chart patterns encompass a series of price movements and are considered more reliable for long-term predictions. Candlestick patterns, like doji or engulfing patterns, form from one, two, three, or more candlesticks and provide insights into short-term market movements. Candlestick patterns help identify immediate price action and potential entry or exit points.
The key difference is the time frame. Chart patterns focus on longer trends, while candlestick patterns highlight shorter-term market behavior. Chart patterns are made of candlesticks, that’s why they are referred to as “Candle stick chart patterns.” All candlestick patterns offer quicker signals based on one or a few trading sessions. Chart patterns signal continuation and reversal trends, offering a broader analysis, whereas candlestick patterns focus more on market sentiment and price action over shorter periods.
Chart patterns provide insights into the future direction of prices by identifying market trends and potential movements over extended periods. The patterns help traders and investors decide about trend continuation or reversal. Candlestick patterns offer precise signals for timing and entry prices, making them ideal for short-term strategies and quick market reactions. Traders enhance their decision-making and improve trade execution by combining chart patterns for directional analysis and candlestick patterns for entry optimization.
The Best Indicators to use with Chart Patterns are listed below.
- Fibonacci Retracements: Fibonacci retracements help identify key levels of support and resistance. They confirm potential reversal or continuation points when used alongside a chart pattern indicator, improving the precision of trades.
- Moving Averages (MA): Moving averages help identify the trend direction. They confirm whether the market is in an uptrend or downtrend when used with a chart pattern indicator, providing a clear view of the trend’s strength and potential breakouts.
- Relative Strength Index (RSI): The RSI measures overbought or oversold conditions. It helps confirm the likelihood of a reversal or continuation combined with a chart pattern indicator, enhancing the accuracy of entry and exit points based on market momentum.
- Moving Average Convergence Divergence (MACD): The MACD shows trend strength and momentum by analyzing the relationship between two moving averages. A chart pattern indicator alongside MACD helps confirm the strength of a pattern’s breakout, increasing trade reliability.
- Bollinger Bands: Bollinger Bands indicate volatility and price levels relative to moving averages. Chart pattern indicators help identify breakout points and provide context to the market’s volatility, improving the accuracy of trade decisions.
- Volume: Volume is a critical indicator when confirming chart patterns. A strong breakout accompanied by high volume suggests a valid move. A chart pattern indicator integrated with volume analysis improves trade accuracy by confirming whether sufficient market participation supports a price movement.
Traders can combine Chart Patterns with Technical Indicators by employing indicators to verify the validity of chart patterns. For example, moving averages help identify the trend direction, while the relative strength index (RSI) indicates overbought or oversold conditions that support the formation of a pattern. Combining chart patterns with Technical Indicators increases the accuracy of trade signals by providing additional confirmation. Indicators such as the MACD (Moving Average Convergence Divergence) show momentum when aligned with a chart pattern, strengthening the signal for entry or exit. The combination reduces the likelihood of false signals, enabling traders to make more informed decisions. Integrating Technical Indicators with chart patterns allows traders to filter out weaker patterns and focus on patterns with higher potential.
The Tips for Learning Chart Patterns are listed below.
- Compare Chart Shapes to Real-World Objects: Associate patterns with familiar items, like a “double bottom” with a camel’s humps, which helps the brain retain them more naturally.
- Do “Blind Chart Drawing” Exercises: Hide ticker symbols and trace peaks and troughs by hand so traders focus on pure price structure without bias.
- Flip the Chart Orientation: Invert charts or mirror them horizontally to eliminate preconceived ideas of bull or bear patterns and see structures more objectively.
- Analyze Non-Financial Charts: Study shapes in data like weather graphs or sports statistics to build raw pattern-recognition skills without market bias.
- Play “Guess the Next Bar” Games: Reveal historical price action one candle at a time and predict the next move. It forces active engagement with emerging patterns.
- Fractal and Multi-Timeframe Pattern Integration: Patterns repeat across different timeframes, so examining multiple timeframes, like 1-hour, daily, weekly, helps confirm the pattern’s direction and improves trade decisions by aligning biases across timeframes.
- Volume and Order Flow Context: Analyze volume shifts within patterns using tools like volume profiles or footprint charts. Volume confirmation validates or invalidates patterns, increasing the reliability of trade signals.
- Statistical Validation and Pattern “Edge” Testing: Backtest patterns using a large dataset to assess their reliability and performance. Statistical metrics like win rate and Average Favorable Excursion help refine stop-loss and take-profit strategies.
- Pattern Failure as a Strategy in Itself: Recognize when a pattern fails and trade against the original thesis. Traders profit from false breakouts by identifying failure points, such as a reversal after a breakout.
- Contextualizing Patterns Within Market Regimes: Patterns behave differently in varying market environments. Classifying market conditions, like rending, ranging, volatile, and adjusting strategies based on volatility indicators improves pattern success.
- Practice with Demo Trading: Using a Demo Account allows traders to practice identifying chart patterns without risking real money. It helps build confidence and understand how different patterns play out in various market conditions.
Fibonacci Retracements improve Chart Pattern Analysis by providing key levels of support and resistance that align with market behavior. Fibonacci retracements help identify potential reversal points within a trend, marking areas where the price pulls back before continuing toward the primary trend. The levels, such as 23.6%, 38.2%, 50%, 61.8%, and 78.6%, are used to spot areas of interest in chart patterns. Traders gain more accurate predictions and refine their entries and exits by combining Fibonacci retracements with existing patterns. These retracement levels act as a guide, confirming chart patterns like triangles, channels, and head and shoulders by highlighting key zones for price reversals or continuations.
The common Mistakes that Traders make when using Chart Patterns are listed below.
- Not Setting Proper Stop-Loss Levels: Placing stops too tight, too wide, or without logical positioning results in significant losses or premature exits. Traders must set stop-loss levels based on the volatility of the asset or key support/resistance levels to avoid being stopped out too early or exposed to large losses.
- Misidentifying Patterns: Confusing similar patterns, ignoring key characteristics, or trading before complete formation leads to poor trade decisions. Traders must ensure they understand the entire formation of the pattern and only enter trades when the pattern is formed and confirmed, reducing the risk of incorrect analysis.
- Ignoring Volume Confirmation: Entering trades without volume validation results in false breakouts and unreliable signals. Traders must check for volume confirmation when a breakout occurs, as volume spikes signal the validity of the move, helping to avoid false signals.
- Forcing Patterns that Do not Exist: Seeing patterns due to bias, over-trading minor moves, or ignoring timeframe context leads to incorrect analysis and unnecessary trades. Traders must avoid fitting patterns to random price movements and instead focus on high-quality, well-defined chart patterns to ensure their analysis is based on objective data.
- Entering Trades Too Early: Anticipating breakouts prematurely without confirmation or indicator validation increases the risk of false signals. Traders must wait for clear confirmation of the breakout, such as a sustained price move above resistance, along with supporting indicators, to improve the reliability of their trades.
- Ignoring Market Context and Trend Direction: Trading against trends, neglecting macro factors, or missing key levels results in losses. Traders must consider the broader market context, including the prevailing trend and fundamental factors, to ensure their trades align with the market sentiment.
- Overreliance on Patterns Alone: Relying solely on chart patterns without considering other technical indicators leads to incomplete analysis. Traders must integrate additional tools like moving averages, Relative Strength Index (RSI), or Moving Average Convergence Divergence (MACD) to complement pattern recognition, providing a more comprehensive analysis of potential price movements.
- Ignoring Risk Management: Failing to manage risk properly, such as using improper position sizing or not adjusting, a stop loss, resulting in significant losses. Traders must establish a clear risk management plan that includes proper position sizing, stop-loss levels, and regular adjustments based on market conditions to protect their capital.
- Disregarding Time Frames: Focusing only on a single time frame without considering others leads to misleading pattern interpretations. Traders must analyze multiple timeframes to get a broader market view, ensuring patterns align across different periods for stronger confirmation.
To read chart patterns, there are five steps to follow. First, identify the trend by analyzing the price movement over a specific period. Look for clear upward, downward, or sideways trends. Second, focus on key patterns such as triangles, channels, head and shoulders, and double tops/bottoms. These patterns signal potential trend reversals or continuations. Third, examine volume, as higher volume during a breakout confirms the strength of a pattern. Fourth, pay attention to time frames, as patterns vary across time scales. Lastly, practice chart reading regularly to become familiar with common patterns and their implications. Understanding these factors improves the accuracy of chart reading and enhances trading decisions.
Market Psychology influences chart patterns in trading by shaping trader behavior and decision-making. Traders’ reactions to fear and greed drive price movements, creating recognizable chart patterns. Market Psychology plays a key role in forming trends, as traders follow the herd during periods of optimism or panic. Fear leads to sharp sell-offs, resulting in bearish patterns like head and shoulders or descending triangles. Greed fuels rapid buying, leading to bullish patterns such as ascending triangles or breakouts. The collective emotional response of traders influences these patterns, making them a reflection of Market Psychology. Emotional extremes in the market lead to overbought or oversold conditions, reinforcing patterns like support and resistance levels. Understanding Market Psychology helps traders anticipate potential price movements based on common psychological triggers.
A study by Shiller in the Journal of Economic Perspectives titled “Measuring Bubbles” discusses how irrational behavior among traders affect market outcomes. The study highlights that psychological factors like overconfidence, herd behavior, and emotional reactions like fear and greed contribute to market fluctuations. Shiller’s research emphasizes how these emotional influences lead to the formation of speculative bubbles and crashes, which manifest in recognizable chart patterns. Understanding these psychological drivers helps traders anticipate market trends and better navigate volatile conditions.
AI and Machine Learning will impact Chart Pattern Analysis by enhancing the ability to detect and analyze complex patterns. AI and Machine Learning process large volumes of data at high speeds, identifying trends that are not easily visible to humans. Machine Learning models recognize repeating patterns, even in volatile markets.
AI algorithms adapt to changing market conditions, improving prediction accuracy over time. Patterns that take hours to analyze manually are evaluated in seconds. AI models learn from past data, refining their analysis methods. It increases the reliability of pattern recognition and reduces human error. Traders gain access to more precise insights by using AI, helping in decision-making processes. For example, algorithms more effectively identify candlestick patterns, support and resistance levels, and chart formations.