Volatility is a measure of how much and how quickly the price of an asset or security fluctuates over a given period. Volatility is important because it allows traders, investors, and other market participants to understand how and why market price fluctuations affect investment asset performance.
There are nine different types of volatility. These are historical volatility, current volatility, future volatility, implied volatility, realized volatility, GARCH volatility, Parkinson volatility, Garman-Klass volatility, and range volatility.
Traders and investors calculate market volatility by collecting historical data about an asset and calculating its variance and standard deviation. An example of volatility in the market includes the 2008 financial crisis, when the mortgage bubble burst, triggering massive volatility in financial markets globally.
The benefits of volatile markets include more profit opportunities, enhanced market liquidity, better risk management, and increased bargain-hunting opportunities.
The downsides of volatile markets include increased risk of losses, higher trading costs, emotional and psychological stress, reduced market liquidity, and difficulty timing the market.
What is Volatility?
Volatility is a statistical measure of the degree of variation or fluctuation in the price of an asset, such as a stock, commodity, or currency, over a given period. The volatility of a market is high if there are large and frequent price swings and low or stable if the market swings are small and short-lived.
Volatility in finance indicates the risk levels associated with investments. Traders and investors use statistical methods like standard deviation and variance to quantify the variation in the returns of an asset. Volatile markets offer traders the highest profit potential, but wild price swings can result in massive losses if the markets go against the trader’s position.
Volatility in markets arises due to economic factors like economic data releases and monetary policy or fiscal policies, political and geopolitical events like elections, wars, and conflicts, global events like financial collapses or recessions, and company-specific news like earnings reports, mergers, and acquisitions.
The volatility meaning in forex, stocks, and other financial markets implies a liquidity imbalance. For instance, high volatility implies there are significantly more buyers for a currency pair than sellers, resulting in wild price swings when traders place large trades.
Volatility is a common forex trading term used when forex traders conduct technical and fundamental analysis, seeking confirmation for trend continuation or reversal.

What is the importance of Volatility?
Volatility is a critical concept in financial markets as it provides insights into how prices move, enabling market participants to estimate future price swings and adjust their strategies for long-term profitability. Traders, investors, risk analysts, and policymakers rely on volatility when deciding the risks, potential returns, and overall market sentiment associated with an asset or market.
High volatility in investment assets indicates higher risk when buying, selling, or holding financial assets. Long-term traders and investors avoid volatile assets due to their unpredictable nature, favoring less volatile assets that are more liquid and stable. According to a study by David C. Blitz et al. (2007) on the ‘Volatility Effect,’ investors and portfolio managers with low historical volatility assets record higher risk-adjusted returns. The study found that low-volatility traders experienced relatively small drawdowns and a solid performance in bear market conditions.
Traders measure market volatility using complex models and historical data, making it easier to anticipate and react to rapid price changes in a volatile market. Risk managers combine assets experiencing different volatilities as a diversification technique, allowing them to reduce the exposure on their portfolios and hedge positions against potential losses.
Volatile markets provide multiple trading opportunities for short-term traders, scalpers, and day traders, attracting more buyers and sellers in the market and injecting market liquidity. When price spikes up and down rapidly, market participants generate above-average profits quickly if they follow a disciplined trading approach.
Market regulators use volatility to determine the regulatory capital requirements for financial institutions, ensuring they have adequate capital to cover their clients in case of a liquidity crunch, e.g., the financial crisis of 2008.
Volatility in forex trading is vital because it affects how forex traders analyze and spot opportunities, their risk management plans, and how they execute trading strategies. High volatility increases the risk experienced in forex markets, especially among leverage traders, and influences how forex brokers execute trading orders.
Volatility in forex trading results in large price movements in currency pairs, providing more opportunities for traders to exploit and make a profit. Short-term traders open long and short positions more often, leading to higher trading activity and contributing to price discovery.
Forex traders incorporate market volatility into their trading strategies as confirmations that provide clues on the optimal entry and exit points. For instance, breakout traders look to take trades during periods of high volatility to take advantage of early entries or continuation trades. Range traders look for opportunities during low volatility conditions when markets are stable, and risks are easier to manage.
Volatility in the forex markets affects the risk management habits of traders and investors because it gives a clear picture of the risks involved in opening trades on a specific market. Traders use stop-loss orders, reduce their leverage or margin ratios, and cut their position sizes and risk-reward ratios when trading highly volatile currency pairs to avoid margin calls.
Experienced traders incorporate volatility in their “forex trading definition“, terming it as the rate at which currency pairs fluctuate over a given period.
What are the different Types of Volatility?
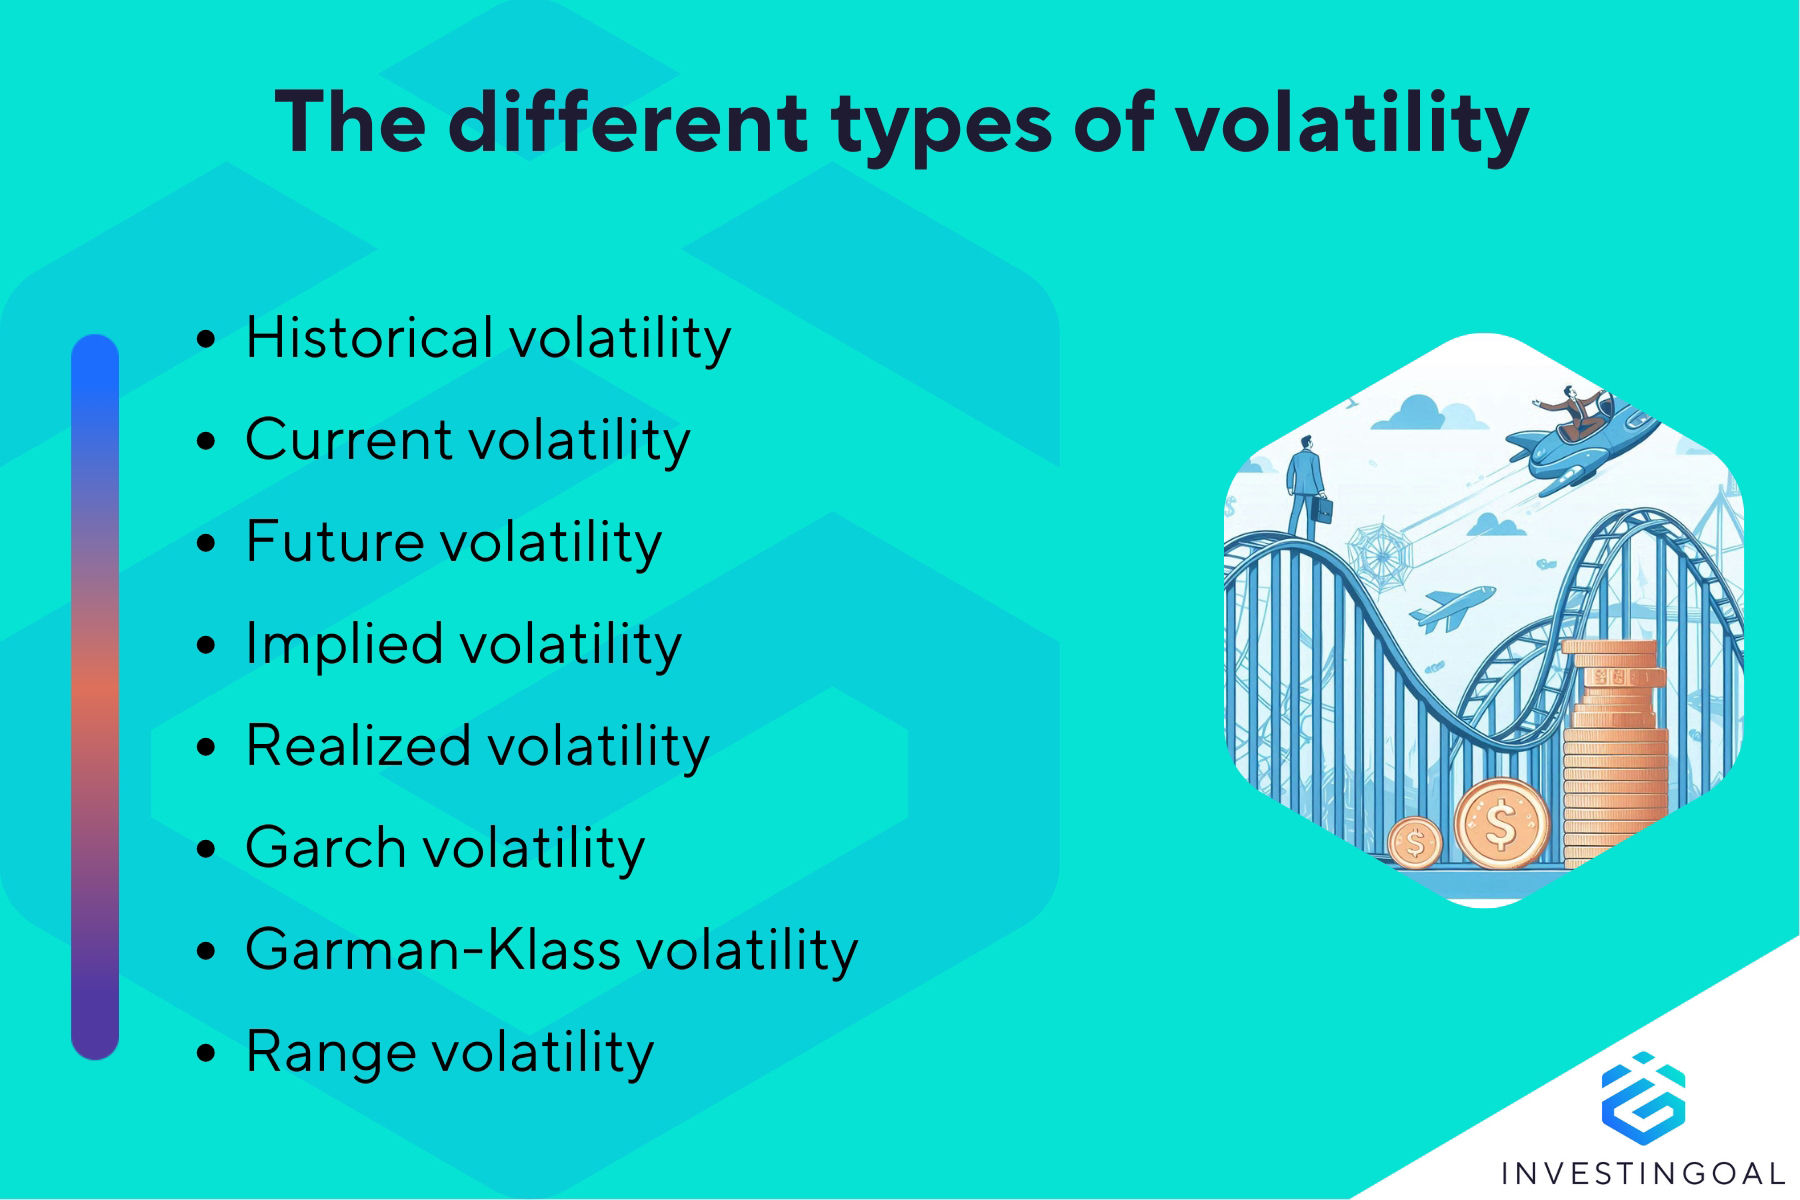
The different types of volatility are listed below.
- Historical volatility
- Current volatility
- Future volatility
- Implied volatility
- Realized volatility
- Garch volatility
- Garman-Klass volatility
- Range volatility
Historical volatility is a statistical measure of the magnitude of price changes of a financial instrument, such as a currency, stock, or bond, over a defined historical period. Historical volatility is measured by calculating the annualized standard deviation of daily asset price returns over several trading days.
Traders collect historical data, calculate the returns for each period as a percentage change from one period to the next, and finally calculate the standard deviation. A high historical volatility indicates greater asset price fluctuations in the past, while a falling or low historical volatility shows that price is more stable.
Historical volatility allows traders to evaluate the potential risk involved with an asset and helps investors develop trading strategies based on historical volatility data. Forex traders combine historical volatility with indicators such as technical analysis to make reliable forecasts on future price movements.
Current volatility is the level of price fluctuations observed in the market for a specific financial instrument or index. Current volatility tracks real-time price movements and measures the changes in price throughout a trading day, including rapid price responses to news and economic events.
Traders and investors measure current volatility by determining the highest and lowest prices traded during a trading session, forming the intraday price range. Real-time updates on current volatility are accessible on volatility indexes like the VIX (Volatility Index).
Current volatility is useful to forex spot traders as it allows them to adjust their short-term strategies based on the current volatility levels. Forex traders find it easier to manage risk when placing trades since current volatility enables them to assess the anticipated level of risk associated with short-term trading.
Investors use current volatility when making decisions about portfolio allocation and diversification, ensuring they can match their risk tolerance. Changes in current volatility often reflect shifts in market sentiment and investor expectations, affecting overall market behavior.
Future volatility is the anticipated measure of the market’s degree of price fluctuations over a specific period and ending at a future date. Future volatility is forward-looking and reflects the market’s future expectations for the price of a financial instrument, allowing traders and investors to assess potential risks and make informed decisions.
Future volatility is important for the correct pricing of options and other derivatives. Traders and investors measure future volatility using volatility forecasting methods such as Generalized Autoregressive Conditional Heteroskedasticity (GARCH) models that calculate future volatility based on past volatility and Exponentially Weighted Moving Average (EWMA) models, which give more weight to recent price observations.
Forex traders use upcoming data releases, central bank meetings, and macroeconomic factors like interest rates and inflation rates to prepare for potential future volatility. Traders utilize market indicators like the VIX (Volatility Index) to anticipate future volatility based on the 30-day stock market volatility for the S&P 500 index.
Implied volatility (IV) measures the future volatility of an asset derived from the current price of an option contract for the underlying asset. Implied volatility shows the projected price fluctuations of an asset over the life of the option contract, usually a few weeks to months.
Traders and analysts calculate implied volatility using complex options pricing models such as the Binomial model and the Black-Scholes model, which account for the strike price, the time to expiration, the risk-free interest rate, and the underlying asset’s current price.
Implied volatility reflects the market’s expectations about future price movements, with a higher IV suggesting greater expected fluctuation and a lower IV signaling a stable market.
Implied volatility allows forex traders to speculate on future volatility changes without the need to predict market direction. IV allows traders to capitalize on volatility arbitrage where there is a difference between implied volatility and actual or expected future volatility.
Understanding implied volatility helps traders and investors design effective hedging strategies to mitigate the risks associated with large price movements and adjust their portfolios based on changes in IV to optimize returns.
Implied volatility indices such as the VIX experience increased prices with an increase in the underlying asset’s demand, resulting in premium prices for options. An option is considered mispriced if the actual asset volatility differs from its implied volatility.
Realized volatility is the actual volatility of a security, such as a currency pair, over a specific period in the past. Realized volatility involves a backward-looking measure that uses historical data to indicate past variability of asset prices.
Traders and investors calculate realized volatility by collecting a series of historical prices for an asset, calculating the returns for each period, and then determining the standard deviation of the returns, which represents the volatility of the security or asset. High realized volatility suggests that an asset experienced large price fluctuations in the past, while low realized volatility reflects small price movements in the past.
Realized volatility is calculated over different time frames, from daily, weekly, monthly, to annual. Short-term realized volatility provides insights into immediate price movements, while long-term realized volatility gives a broader perspective on historical price stability.
Realized volatility is important to traders and investors because it helps them assess the historical risk associated with an asset, allowing them to adjust risk management strategies accordingly. Traders use realized volatility to evaluate the performance of a trading strategy, allowing them to develop strategies aligned with historical price movements and market conditions.
Generalized Autoregressive Conditional Heteroskedasticity (GARCH) is a statistical model used to analyze and forecast the volatility of asset returns over time. GARCH volatility focuses on clustering periods of high volatility followed by periods of low volatility and incorporates the past returns and past volatility of the time series to forecast future volatility.
Researchers and analysts use statistical techniques like the Maximum Likelihood Estimation (MLE) to choose between different variants of GARCH models based on their ability to forecast future volatility and how well they fit the data.
GARCH offers more accurate forecasts of future volatility than simpler traditional methods. Large financial institutions like hedge funds use GARCH to estimate and forecast volatility in forex markets, helping them manage portfolio risk. GARCH is flexible and accommodates different distributions containing additional variables, such as macroeconomic factors or news events, making it ideal for pricing options and other derivatives.
Parkinson volatility is a measure of historical volatility that uses an asset’s daily high and low prices over a given period. Parkinson volatility is also known as range-based volatility and uses the natural logarithm of price ranges (high and low prices) to estimate volatility.
Traders calculate Parkinson volatility by finding the difference between the highest and lowest prices, dividing it by two, and then taking the natural log and raising it to the power of two. Add the results over the observed series; the answer is the estimate of the standard deviation of the daily log returns. A high value indicates high asset volatility, while low values indicate stable market conditions.
Traders and investors use Parkinson volatility because it is easy to compute and is less sensitive to outliers, making it useful in volatile markets with extreme price movements.
Garman-Klass volatility is a measure of historical volatility based on an asset’s open, high, low, and close prices. Garman-Klass is an extension of the Parkinson volatility estimator that incorporates an asset’s opening and closing prices in the calculations as weighting factors that improve its ability to capture price movements throughout the trading period.
Garman-Klass volatility is ideal for the forex market due to the continuous nature of currency trading and the importance of open and closed prices in daily price movements.
Traders and investors rely on the Garman-Klass volatility to provide an accurate picture of the intraday price swings, leading to a better estimation of future volatility. Technical analysts use Garman-Klass to improve their forecasting accuracy and develop trading strategies with better alignment to the expected price volatility.
Range volatility, also known as high/low range, measures an asset’s volatility based on the range formed by the difference between the highest and lowest market prices over a specific period.
Traders calculate range volatility by collecting the high and low prices for each day over a fixed period, say five days. Find the daily range for each day, then average the daily ranges to get a sense of the typical daily range volatility over the period. A large range value indicates higher volatility, meaning price has fluctuated more significantly within the period, while a smaller range suggests lower volatility.
Range volatility is popular among forex and stock traders because it is easy to calculate, and high and low prices data is readily available for most assets.
How to Calculate Volatility?
Volatility calculation involves seven steps. First, collect the asset’s past prices; second calculate the daily returns; third, find the mean of the daily returns; fourth, calculate the deviations; fifth, calculate and add square deviations; sixth, calculate the variance of returns; and finally, calculate the standard deviation of returns. The seven steps for calculating volatility are listed below.
- Collect the asset’s past prices. Gather the closing prices of the asset for a specific period, for instance, daily closing prices for the past 30 days.
- Calculate the daily returns (Ri). Obtain the daily returns by subtracting the previous day’s closing price from the current day’s closing price and dividing by the previous day’s closing price. The formula to calculate daily returns is Ri = (Pi – Pi-1) / Pi-1, where Ri = daily return for day I, Pi = closing price for the current day, and Pi-1 = closing price for the previous day.
- Find the mean of daily returns (μ). Add each value of daily returns for the specified period, then divide the total by the number of returns in the data set (e.g., 30 if using a 30 days period). The answer is the mean, or average, or μ, of daily returns.
- Calculate the deviations (di). Subtract the mean (μ) from each daily return (Ri) to get the difference between each price in the set and the mean price. The formula to calculate daily deviations is di = Ri – μ.
- Calculate the squared deviation (di2). Square the deviations to eliminate negative values, then add all the squared deviations. The formula to calculate squared deviations is di2 = (Ri – μ)2. The sum of all squared deviations is given by ∑ (Ri – μ)2.
- Calculate the variance of returns (σ2). Divide the sum of squared deviations by the number of data values to obtain the variance of returns or volatility variance. The formula for calculating variance is σ2 = (Σdi2) / (n – 1), where n is the number of daily returns.
- Calculate the standard deviation of returns (σ). Find the square root of the variance to obtain the standard deviation or volatility of the asset. The standard deviation or volatility formula is given as σ = √ σ2, where σ is the standard deviation or volatility.
Traders use Forex broker platforms to identify market volatility using methods and tools like volatility indicators, historical volatility charts, volatility alerts, volatility-based strategies, options trading tools, news and economic calendars, and volatility-adjusted order types. Forex broker platforms offer these tools to encourage traders to incorporate volatility analysis into their trading strategies.
Volatility indicators like Bollinger Bands, Average True Range (ATR), and Standard Deviation (SD) are excellent tools specifically designed to measure volatility. Most forex broker platforms offer these indicators and more, making it easier for traders to try out different indicators and determine the best one for their strategy.
Traders utilize historical volatility charts offered by FX broker platforms to analyze past price movements for various currency pairs and understand the typical volatility range for specific currency pairs. The volatility alerts on some broker platforms notify traders when volatility reaches certain levels, making it easier to take trades using volatility-based strategies.
Novice forex traders look for periods of consolidation or low volatility in the market and craft strategies based on a volatility breakout. Chart tools like rectangles, triangles, and trendlines help traders identify common chart patterns that signify potential volatile breakouts from tight trading ranges or the start of a new volatile trend.
Scalpers and day traders use the news and economic calendar feature to identify periods of heightened volatility in the trading day. Most of the top forex broker platforms provide an economic calendar to prepare traders for major announcements like Non-Farm Payrolls (NFP) and Central Bank meetings, which increase market volatility significantly.
Traders apply volatility-adjusted trade orders like volatility stop orders, volatility-adjusted limit orders, and volatility-adjusted position sizing to prevent excess losses from volatile market conditions. Volatility-adjusted trade orders ensure that traders have a low-risk tolerance during periods of high volatility and a high-risk tolerance in low-volatility market conditions.
Forex traders utilize volatility as a key factor in making trading decisions by incorporating it into their trading strategies and risk management. Traders try to understand when volatility will increase or decrease in the forex market to modify their trading positions for the expected volatility impacts and avoid unpredictable market conditions.
Breakout forex traders use increases in volatility as breakout confirmations to avoid false breakouts. The increased volume in a volatile market assures the trader that there is enough momentum to facilitate trend continuation.
Traders consider volatility when setting stop-loss and take-profit levels to accommodate potential spikes in volatile markets and avoid premature triggering. High volatility prompts forex traders to reduce their position sizes to minimize potential losses, while low volatility encourages traders to increase their positions to capture more profits.
The six ways to manage market volatility are listed below.
- Apply Risk management. Set stop-loss orders, avoid excessive leverage, and hedge open positions to limit potential losses.
- Adjust trading strategies. Incorporate more diversification in volatile markets by opening positions to spread risk across less volatile asset classes, e.g., futures or options.
- Use Volatility Indicators. Utilize volatility-based indicators like Bollinger Bands, Moving Averages, and Average True Range to identify periods of high and low volatility in the forex market or the Volatility Index (VIX) to gauge overall stock market volatility.
- Stay Informed. Keep up-to-date with economic news, central bank policies, and geopolitical events that influence market volatility, and regularly review portfolio performance and risk exposure.
- Monitor Position Sizes. Adjust position sizes depending on market volatility by placing large positions in less volatile markets and smaller positions in more volatile markets.
- Be Patient and Disciplined. Stick to the trading plan and risk management strategy to avoid making impulsive decisions triggered by fear and greed.
The economic calendar in currency trading affects market volatility by creating uncertainty among traders and investors, increasing trading activity and increasing volatility. Forex traders monitor economic calendars closely, waiting to see if the actual data released differs from the expected consensus figures from market analysts.
The increased uncertainty leading up to major economic releases often features extremely wild price swings as some traders become more cautious while others react to rumors, leaks, and fake information.
Traders and investors are usually unsure about the outcomes of key scheduled economic calendar events like the Non-Farm Payrolls (NFP), Central Bank rate decisions, and inflation reports, so they increase their buying and selling activities as they try to adjust their positions to accommodate all potential outcomes.
Volatility is managed by risk management in various ways, including diversification, position sizing, setting stop-loss orders, hedging, and sticking to a predefined trading plan. Risk management ensures that traders minimize their potential losses in volatile market conditions by understanding their risk tolerance and choosing appropriate trading strategies.
Diversification allows traders to spread their risk across different assets, reducing their exposure to any single risk factor. Diversification complements hedging strategies where the trader opens positions in other assets to offset potential price risks in an existing position.
Position sizing and using stop-loss orders protect the trader from excess losses due to violent price spikes during actively volatile sessions, e.g., during news releases.
Sticking to a predefined trading plan is usually the ultimate risk management definition for new traders, as it helps them avoid impulsive decisions like FOMO (fear of missing out) during volatile market conditions.
What are examples of Volatility?
An example of volatility in forex trading is evident during major events like central bank announcements. For instance, before a European Central Bank (ECB) interest rate decision, EUR/USD often trades in a relatively narrow range, reflecting cautious sentiment, but if the ECB unexpectedly announces a 0.25% interest rate hike, the EUR/USD experiences a sudden and sharp rally from 1.1100 to 1.1250 in minutes as traders adjust positions to reflect the higher interest rates in the Eurozone. After the announcement, volatility often remains elevated as traders assess future policy guidance and economic data releases.
The forex market experienced high volatility in the Swiss Franc (CHF) ‘flash crash’ of January 2015 when the Swiss National Bank (SNB) unexpectedly removed the currency peg against the Euro (EUR/CHF), leading to a sudden and massive appreciation of the Swiss Franc and drastically increasing the volatility in the Swiss-related currency markets. The EUR/CHF pair plummeted from around 1.20 to below 0.85 in a few minutes, causing significant losses for traders.
An example of volatility in the stock market occurred during the 2008 global financial crisis when the S&P 500 fell over 57% after the collapse of the Lehman Brothers and the subprime mortgage crisis unfolded. The VIX, fear index, or Volatility Index, recorded a record high of 89.5 in October 2008 since banks, investors, and the financial markets panicked. Volatility remained elevated and triggered a global recession.
During the 2016 Brexit Referendum in the UK, the British Pound fell over 8% against the dollar (GBP/USD) after the UK voted to leave the European Union. The UK stock market index, FTSE 100, initially fell 5.6% but then recovered all its losses to close 0.3% higher, demonstrating significant volatility after the news.
What are the Benefits of Volatile Markets?
The benefits of volatile markets are listed below.
- More profit opportunities: Volatile markets allow traders to profit from short-term price swings.
- Enhances market liquidity: Volatile markets attract short-term market participants like scalpers, arbitrageurs, and day traders who seek to profit from the rapid price movements, resulting in increased trading activity and higher liquidity.
- Better risk management: Volatile markets enable investors to increase their hedging activities using derivatives like options and futures to protect their positions.
- Bargain hunting opportunities: Volatile markets lead to corrections that allow long-term investors who use buy-and-hold strategies to buy financial securities at discounted prices.
- Enhances innovation and strategy development: Volatile markets drive the development of new financial products and trading strategies, fostering innovation and resilience in the finance industry.

What are the Downsides of Volatile Markets?
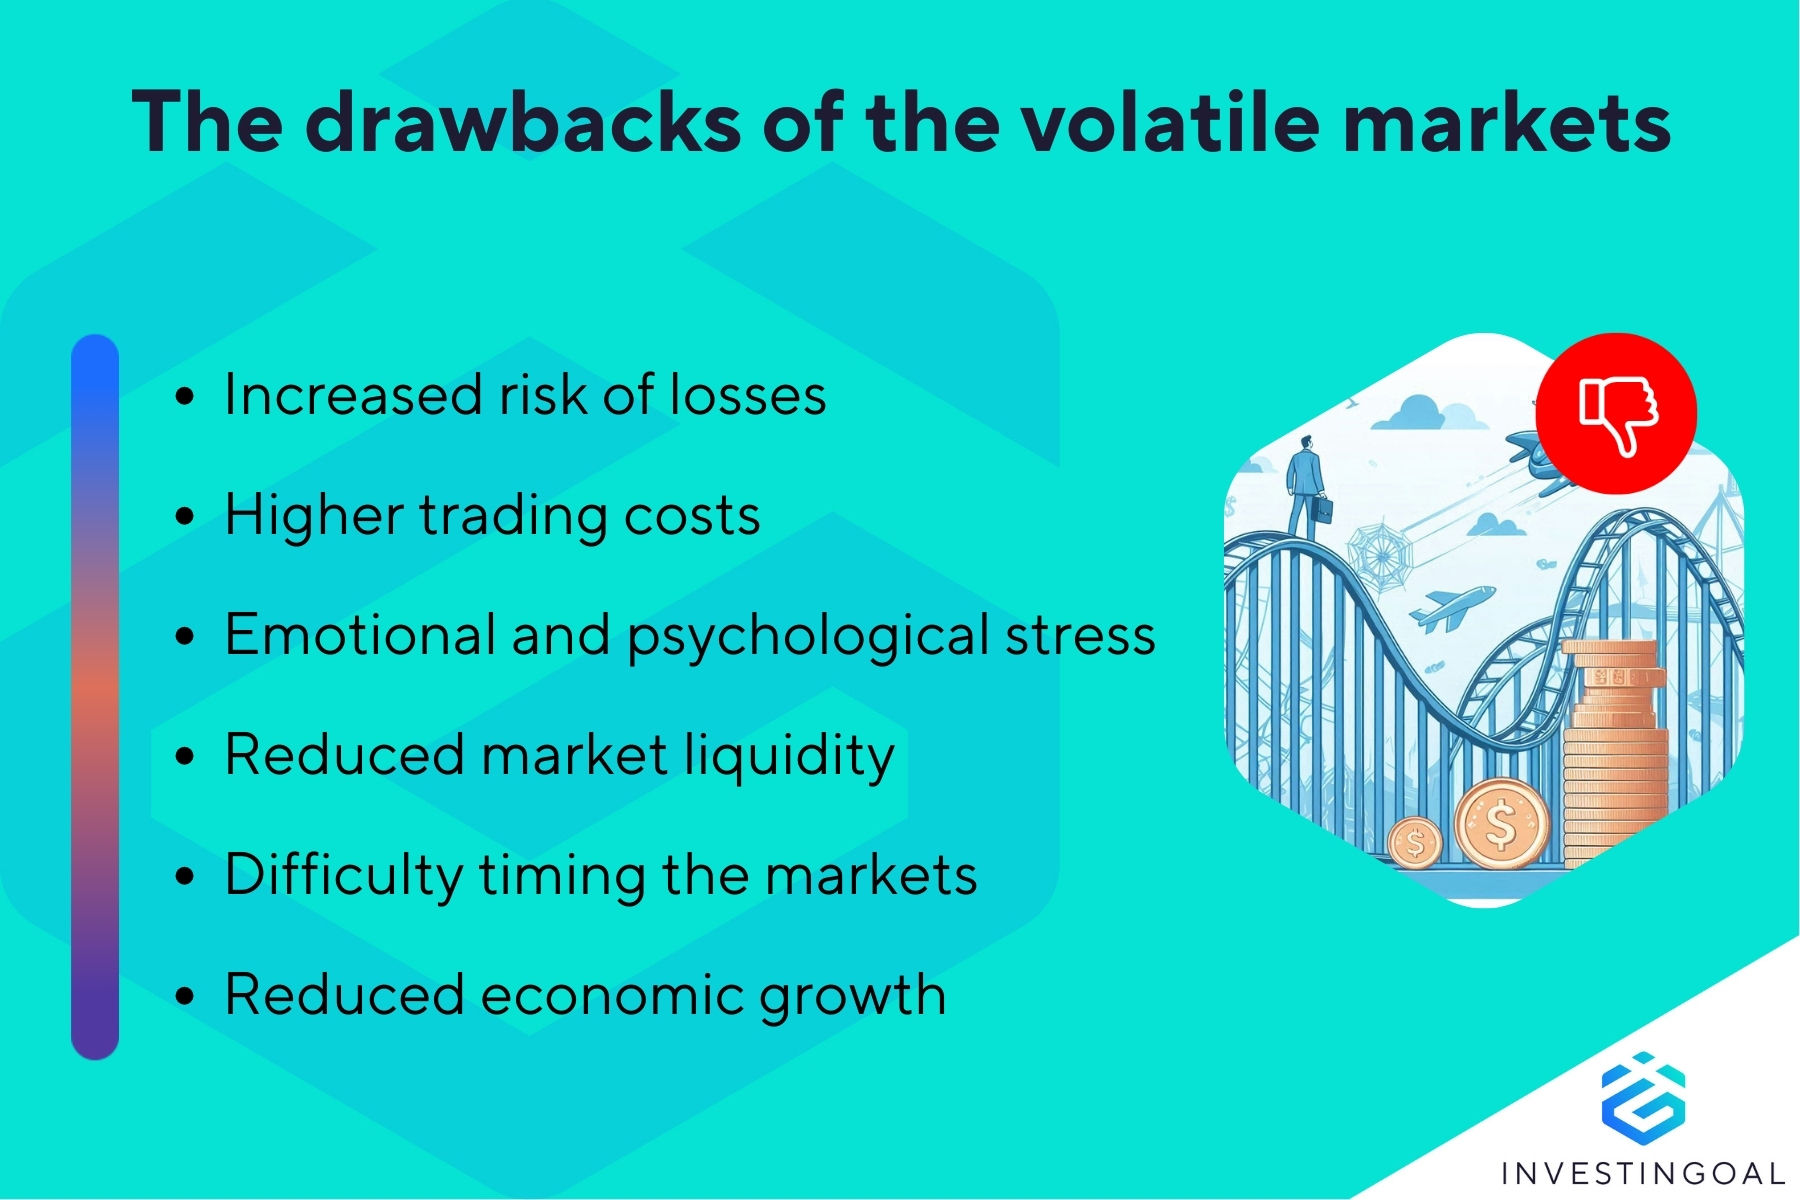
The downsides of volatile markets are listed below.
- Increased risk of losses: Volatile markets increase the risk of losses for inexperienced or unprepared traders due to extreme price swings.
- Higher trading costs: Brokers and market makers widen spreads in volatile markets to compensate for the increased risk, leading to higher trading fees.
- Emotional and psychological stress: Traders panic and experience anxiety or stress when markets make sudden price swings, leading to poor trading decisions made out of fear or greed.
- Reduced market liquidity: Volatile markets scare investors from making new investments, resulting in decreased trading activity and low liquidity in the market.
- Difficulty timing the markets: Volatile markets make it difficult to time the highs and lows, leading to excess losses if the trader gets their entries or exits wrong.
- Reduced economic growth: Volatile markets discourage consumers, investors, and businesses from spending capital and investing in new opportunities, resulting in a contracting economy.
Yes, volatility is a risk for traders, businesses, and economies because of the unpredictability of price fluctuations. High market volatility makes it difficult for market participants to time the markets and forecast long-term investment goals to meet their financial goals.
Traders and investors use volatility to track liquidity risk, credit risk, and systemic risk when assessing the health of an underlying asset. Traders avoid highly volatile markets because the risk of losses is magnified, and small price moves could trigger premature stop-loss orders and margin calls.
Volatility is a risk for businesses and investors because it makes it harder to value assets accurately and complicates investment decisions. Banks and other financial institutions cut back on their lending in volatile market conditions, reducing trading activity (liquidity risk) and increasing the risk of debt default among borrowers (credit risk).
Countries experience volatility risk in their exchange rates when conducting international transactions. High volatility makes an economy’s currency unstable, leading to an unstable business environment (systemic risk) that drives away foreign investors.
Volatility risk is reduced for long-term traders since markets smooth out the short-term price fluctuations over time. Traders implement risk management strategies like stop-loss orders and hedging to manage the unpredictable nature of volatile markets.
Yes, market volatility can be predicted through various tools and models, including economic indicators, historical data, market sentiment, and technical analysis. Various research models indicate that statistical models like GARCH and HAR are properly tuned to forecast volatility in intraday and long-term markets with promising accuracy, according to Salt Financial (2021).
Economic indicators and news releases such as employment data and inflation reports or geopolitical developments like elections and wars are key volatility indicators. Traders anticipate rising market volatility during news releases and scheduled announcements and use statistical models to estimate the potential impact of the volatility on market prices.
Technical analysis tools like Average True Range (ATR) and Volatility Index (VIX) enable traders to assess current volatility levels and predict potential price changes with relatively high accuracy. Combining historical volatility with technical analysis provides the basis for most successful autoregression volatility prediction models like GARCH and EWMA.
Traders and researchers can predict different types of volatility using the Heston model, Markov chains, Monte Carlo simulations, and other stochastic volatility models, but it is impossible to predict the exact market movements resulting from volatility. Volatility prediction models do not reveal the direction of price swings in volatile markets, only the magnitude of the fluctuations.
Yes, high volatility causes slippage to occur in financial markets because the rapid and unpredictable price movements lead to order execution delays. Volatility contributes to imbalanced market liquidity, making it difficult for trade orders to find counterparties since fewer buyers and sellers are willing to participate in the market. Slippage occurs when trade orders are filled at different prices from the intended execution price levels.
High volatility causes price changes within milliseconds, meaning that price can change between the time a trader places a trade and the time the trade is executed, causing slippage.
Traders and investors experience slippage when executing large orders in volatile markets if the order size exceeds the available liquidity at the desired price. Bad price order fills are common in volatile markets since the new long or short orders move prices from the current market price level, and market makers execute them at the next available price.
Volatility arising from significant economic news or geopolitical events causes overnight or weekend gaps, which lead to slippage when price opens at a different level than anticipated.
Traders and investors use the “slippage definition” to understand how volatility and liquidity affect their trading costs and performance.
The difference between volatility and liquidity lies in the aspects of the market they measure. Volatility measures how much the price and returns of an asset or financial security fluctuate over a given period, while liquidity is the ease and speed with which an asset or security can be converted to cash at a fair price without affecting its value.
Volatility and liquidity help traders make informed decisions when placing trades. Trades look to liquidity to determine their ability to execute trades effectively and consider volatility when assessing their risk and potential returns.
Most volatility definitions imply that it exists independently of liquidity, meaning that some markets can be highly volatile yet highly liquid or highly volatile and illiquid, while the liquidity definition implies that volatility is a key component of a market’s liquidity.
The difference between volatility and liquidity lies in their distinct characteristics and effects on financial markets. Volatility is the degree of price fluctuations in any financial instrument over time, while volatility index (VIX) is a specific index that measures the market’s expected volatility of the S&P 500 index over the coming 30 days.
Traders and investors use statistical methods such as standard deviation and variance to measure the average expected returns. Volatility focuses on all financial assets using historical price data, while VIX is calculated from the prices of S&P 500 index options and represents implied volatility, not historical volatility.
The Volatility Index (VIX) is also known as the ‘fear gauge’ or ‘fear index’ because it reflects the market’s sentiment and uncertainty.