The rectangle pattern is a continuation pattern that forms during a trend and indicates that the trend is likely to continue. The rectangle pattern works in three phases, accumulation, consolidation, and distribution.
Traders accumulate orders during the accumulation phase as demand for an asset like a currency pair increases. The resistance and support zones are formed during the consolidation phase when supply and demand are nearly equal, causing price to trade within the defined support and resistance zones. The breakout occurs in the distribution phase when buying pressure rises and buyers take control of the market.
There are two types of rectangle patterns, the bullish rectangle and the bearish rectangle. Bullish rectangle patterns occur in uptrends and signal a bullish breakout for buyers to place long orders, while bearish rectangle patterns occur in downtrends and signal a bearish breakout for sellers to open short positions.
To trade the rectangle pattern, traders identify the pattern, confirm the pattern using volume, wait for a breakout, set entries, place stop-loss and take-profit orders, and then manage the trade.
The advantages of the rectangle pattern include clear support and resistance levels, visual clarity, versatility, clear entry and exit points, and confirmation of market sentiment.
The disadvantages of the rectangle pattern include false breakouts, whipsaw price action, lack of directional bias, limited profit potential, and overlapping patterns.
What is a Rectangle Pattern?
A rectangle pattern is a continuation chart pattern that occurs when the price of an asset, like a currency pair or stocks, moves within a narrow range, bound by two parallel horizontal lines representing support and resistance levels. The rectangle pattern is an indecision pattern, indicating that neither buyers nor sellers have clear control over the market.
The rectangle pattern earns its name from the rectangle shape formed as the price oscillates between the horizontal support and resistance levels. Rectangle patterns form in the middle of the prevailing trend and appear as a pause or brief consolidation in the asset’s price.
The rectangle pattern is valid when the market price touches both the support and resistance lines at least twice to indicate the supply and demand tug-of-war occurring in the market.
Rectangle pattern is also known as range trading or consolidation trading. The rectangle appears on all timeframes, from short-term intraday charts to long-term weekly or monthly charts.

Rectangle patterns hold significant importance in trading as they provide valuable insights into the supply and demand conditions of price in a trend. Rectangle patterns enable traders to spot potential price trends and identify potential breakout opportunities, which are crucial in generating trading opportunities and managing risk.
The rectangle pattern allows traders to spot potential price trends when the price breaks out of the resistance zone in the direction of the existing trends. Traders identify potential reversals when the price breaks out in the opposite direction of the prevailing trend, allowing the trader to close losing positions and avoid potential losses.
Online traders rely on rectangle patterns to identify trading opportunities inside the rectangle or range for range traders and on the breakout for breakout traders. Range traders open buy and sell orders once the price reaches the horizontal support and resistance lines, while breakout traders wait to open trades at the breakout point, anticipating capturing the subsequent price movement.
The rectangle pattern provides traders with clear targets and price levels for placing stop-loss and take-profit orders. Buyers place their stop-loss below the rectangle with their targets at the top of the rectangle, while the sellers place stop-loss orders above the rectangle and targets below the rectangle.
Rectangle patterns are vital in helping traders understand market sentiment and trend strength, allowing them to adjust their trades to align with the trend. The rectangle pattern indicates a state of equilibrium where supply and demand are balanced. Traders use the rectangle pattern to determine when to enter and exit trade positions and when to avoid trading because the price is neutral and could break out in any direction, which aligns with the broader principles outlined in the trading definition.
The rectangle pattern is important in technical analysis and acts as an easy introduction to analyzing markets for beginner traders.
Rectangle chart patterns are not suitable for all types of trading, as their effectiveness varies significantly across different trading approaches and market conditions. Horizontal consolidation patterns like rectangle patterns perform optimally in swing trading, position trading, and technical trading environments where experienced traders can capitalize on the extended time frames that the pattern requires to develop.
Swing trading benefits from rectangle patterns because the consolidation phase provides clear support and resistance levels that align with the multi-day holding periods typical of this approach. Position trading leverages rectangles effectively since these patterns often precede significant trend continuations that unfold over weeks or months. Technical trading finds rectangle patterns valuable as they offer well-defined entry and exit parameters through precise breakout signals.
Rectangle patterns perform poorly in scalping trading and day trading environments because the pattern formation requires substantial time to develop, while these fast-paced strategies demand immediate price movements and frequent position changes.
Understanding the relationship between chart patterns and trading strategies enables traders to select appropriate methodologies that align with their risk tolerance, time horizons, and market analysis capabilities. The rectangle pattern, for instance, proves particularly useful within certain trading types, where sideways price movement and breakout anticipation are integral to the strategy’s success.
The importance of the rectangle pattern in technical analysis lies in its role in identifying and explaining support and resistance levels. The horizontal support and resistance lines in rectangle patterns enable traders to anticipate price movements and help technical analysts incorporate other patterns and indicators like RSI, MACD, and moving averages in their strategy to improve the pattern’s accuracy in confirming the underlying trend’s strength.
The rectangle trading chart pattern makes it easy for technical analysts and traders to confirm consolidation phases in financial markets. Traders look for clear support and resistance zones where price bounces back and forth, enabling them to optimize their entry and exit strategies.
Rectangle patterns allow traders to adopt other technical patterns like flags and triangles, as well as indicators like moving averages, oscillators, and volume tools, in their strategy, providing high-quality continuation or reversal signals.
The rectangle patterns are crucial in introducing novice traders to ‘technical analysis definition’ and enabling them to gain useful insights into potential market sentiment shifts.
How do Rectangle Patterns work?
The rectangle chart pattern is formed when the price temporarily moves into a range between a defined support and resistance level. The rectangle pattern formation relies on the market’s supply and demand dynamic to complete three phases, accumulation, consolidation, and distribution. Rectangle patterns feature a series of highs and lows that are roughly equal in size, creating a rectangular shape.
The rectangle pattern begins with an accumulation phase in the direction of the trend. Traders accumulate positions in one direction, long for instance, increasing the demand for the asset, causing its price to rise. The accumulation phase continues until the market reaches a state of equilibrium where supply and demand are equal, halting the movement of price.
A horizontal line is formed in the accumulation phase when the price attempts to break past a price level two or more times and fails, leading to the creation of a resistance zone. The resistance line forms the upper boundary of the rectangle in bullish markets and the lower rectangle boundary for bearish markets.
Consolidation begins when the price is in equilibrium, and it retraces to a previous resistance zone, which is now turned into a support level or floor. Buyers open trades at the support level, increasing buying pressure and pushing prices higher, while sellers open trades at the resistance level, increasing selling pressure and pushing prices lower, resulting in ranging price movements between the established support and resistance price levels. The consolidation phase may take long to complete depending on market conditions and the timeframe of analysis.
The distribution phase of the rectangle pattern is characterized by a price breakout above the resistance zone or below the support zone. The demand for an asset drastically increases in bullish breakouts, and supply increases in bearish breakouts, indicating an end to the indecision between buyers and sellers.
Price breakouts are often associated with volume increase to indicate strong potential for a sustained move in line with the prevailing trend and to reduce the risk of false signals. Breakout moves tend to be more aggressive the longer the consolidation phase lasts and during high-impact economic data release reactions.
Rectangle chart patterns indicate periods of consolidation and distribution as market sentiment shifts between buyers and sellers in the market. The rectangle chart part shows how supply and demand impacts price movement when buyers and sellers are undecided, and how potential breakouts lead to price continuation in the dominant trend.
Rectangle chart patterns indicate the momentary balance between supply and demand in a market leading to a horizontal trading range or consolidation. The rectangle pattern identifies the price points where buying pressure is strong enough to prevent further price declines (support level), and price points where selling pressure is highest, preventing further price increases (resistance).
Technical analysts use rectangle chart patterns to indicate periods of uncertainty among traders and investors. The rectangle pattern reflects periods in charts where markets experience geopolitical events like wars, economic news releases, and recessions or economic downturns, leading to buyers and sellers taking caution when placing trades due to fear.
Rectangle chart patterns show potential levels where price breakouts occur to signal trend continuation. Traders use this information to get precise entries and exit prices and prepare for potential pullbacks for entries. Rectangle patterns that occur at the end of bullish or bearish trends signal the end of the prolonged trend and the beginning of a new trend.
The target of a Rectangle pattern is typically determined by measuring the height of the trading range and then projecting it from the breakout point. The height of the trading range, or rectangle height, is the vertical distance between the support and resistance level as formed during the consolidation of the asset price.
The target of the rectangle pattern in bullish markets is obtained by adding the height of the rectangle to the breakout price. The target of the rectangle pattern in a bearish pattern is obtained by subtracting the height of the rectangle from the breakout point. For instance, if the rectangle is 50 pips high and the price breaks out to the upside, the target of that rectangle becomes 50 pips above the breakout point.
Experienced traders use technical tools like the Fibonacci extensions, the support and resistance levels, and indicators like the ATR. Fibonacci traders place the targets of the rectangle pattern at levels like 61.8%, 78.6%, 127.2%, and 161.8%, making it easier to project realistic price targets.
Range traders use the support and resistance levels as profit targets because they only capture small range-to-range price movements. Buyers open positions when the price is in a support zone and set the upper horizontal resistance line as the profit target. Sellers execute shorts when the price is in resistance zones and set the rectangle’s lower support line as the profit target.
Yes, the rectangle pattern is a popular chart pattern. Traders use the rectangle pattern because of its market and timeframe versatility and the clear definition of entry and exit opportunities. The formation of the rectangle chart pattern takes a relatively short time, making it one of the easiest chart patterns to identify and trade.
Rectangle chart patterns occur in most financial markets, including Forex, stocks, cryptocurrencies, and commodities. Traders identify the pattern easily on all timeframes including the short-term seconds, minutes, and hourly charts, and long-term timeframes like the daily, weekly, and monthly. The rectangle pattern provides numerous opportunities for scalpers, day traders, swing traders, and position investors, making it popular among traders.
Beginner traders prefer using the rectangle pattern over other trading chart patterns because it offers clear entry and exit price levels, making their decision-making process easier. The short formation time means that traders do not have to wait too long before getting another opportunity if they missed one.
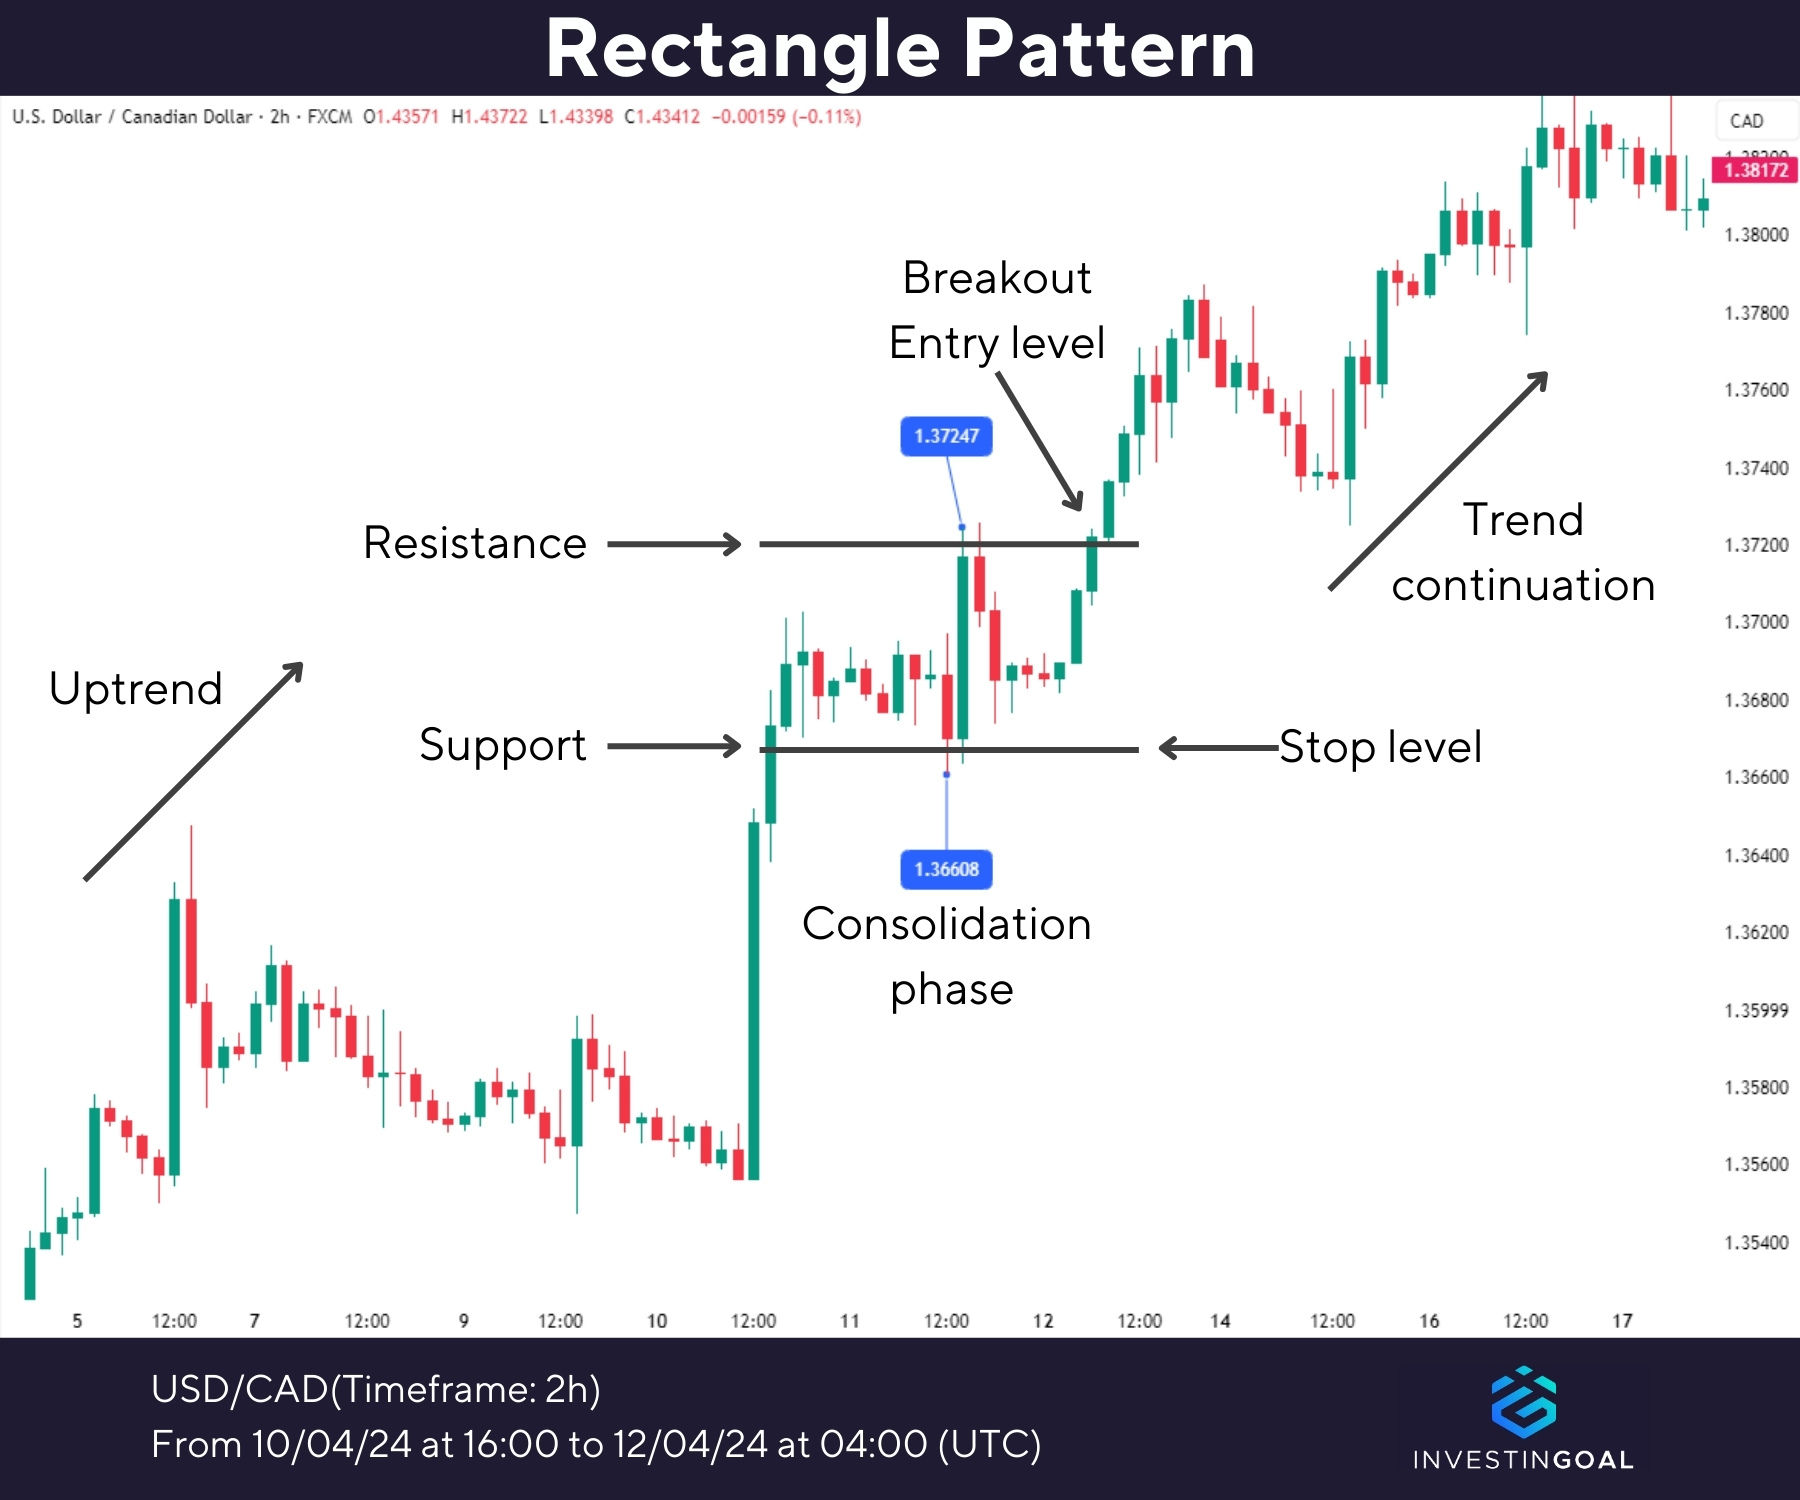
An example of the Rectangle Pattern is shown below.
What are the Different Types of Rectangle Patterns?
There are two types of rectangle patterns. These include the bullish rectangle pattern and the bearish rectangle pattern. The different types of rectangle patterns are listed below.
A bullish rectangle pattern is a continuation pattern that forms in an uptrend when the price consolidates temporarily within a horizontal range bounded by support and resistance levels. Bullish rectangle patterns indicate a period of indecision between buyers and sellers as buyers take profits and close positions.
Bullish rectangles result in breakouts to the upside as market participants become more optimistic about the value of an asset, increasing buying pressure and pushing prices higher. The bullish rectangle pattern typically features a series of relatively equal higher lows and higher highs, indicating equilibrium between supply and demand in the market.
Traders open long trades using the bullish rectangle pattern at the breakout point, slightly above the resistance line. The stop-loss level is set on the support line or just below it, while the take-profit target is obtained by measuring the height of the rectangle from the support line to the resistance line in pips or points and then adding that height to the breakout point.
Online traders keen on stocks, commodities and futures use volume and other technical indicators to confirm the bullish rectangle breakout. Valid bullish rectangle patterns are accompanied by volume spikes, indicating that more traders are interested in buying an asset.
A bearish rectangle pattern is a continuation chart pattern that forms in the middle of a strong downtrend when the price pauses temporarily between two parallel horizontal lines that represent support and resistance levels, creating a rectangular shape.
Bearish rectangle patterns form a series of lower highs and relatively equal lows, indicating a strong supply and decreasing demand for an asset. The bearish rectangle shows that early sellers are taking profits by closing some positions while bulls attempt to initiate a trend reversal. The bearish rectangle pattern resumes its bearish trend when it breaks out to the downside, suggesting that market participants are uncertain or pessimistic about the asset, increasing the selling pressure and driving prices lower.
Traders place short positions using the bearish rectangle pattern slightly below the support zone and the stop orders above the resistance line. The traders measure the height of the rectangle in pips or points, then subtract the value from the breakout point to obtain a take-profit target.
Confirmations for the bearish chart patterns often involve an increase in volume during the breakout, proving that sellers are in control of the market.
How to Trade Rectangle Patterns?
Here is a guide on how to trade the Rectangle pattern effectively.
- Identify the Rectangle Pattern. Look for a period of price consolidation characterized by parallel horizontal trendlines, representing levels of support and resistance.
- Confirm the Pattern. Confirm that the Rectangle pattern is valid by ensuring that the price respects the support and resistance levels of the trading range.
- Wait for a breakout: Wait for the price to break above the resistance level in bullish markets and below the support level in bearish markets. Look for a candlestick to close below and above the support and resistance level to validate the trading signal. Set price alerts when the price approaches support or resistance levels.
- Analyze volume: Observe volume during the consolidation phase to verify that volume decreases as the price moves within the range. Wait for a strong volume spike as the price approaches the support and resistance level to confirm the breakout.
- Set the entry point: Open a long position order when the price breaks above the resistance level. Enter short positions when the price breaks below the support level.
- Place the stop-loss order: Set a stop-loss order just below the support level when trading a bullish rectangle. Place a stop-loss just above the resistance level when trading a bearish rectangle.
- Set the target price: Calculate the height of the triangle by subtracting the support level from the resistance level in pips or points. Add the height to the breakout to find the target price for a long position and subtract the height from the breakout price to set the target price for short positions.
- Manage the trade: Close the position if it reaches the target price or use trailing stops to take partial profits as the price moves in favor of the trade.
Trading with Rectangle patterns is ideal when the market is experiencing a period of consolidation, and there are well-defined support and resistance levels. Market participants trade the rectangle pattern when a breakout occurs, when the markets are calm and experiencing low to moderate volatility, and when volume and technical patterns confirm the signal.
Traders trade the rectangle pattern when a market that was in a clear trend experiences a period of consolidation where it oscillates between two parallel horizontal lines that form the support and resistance levels. A valid rectangle pattern has well-defined support and resistance levels that have been tested at least twice.
Trading the rectangle pattern works when the pattern is complete and a breakout occurs. Bullish or bearish rectangle breakouts provide clear market directions, entries, exits, and stop-loss levels for traders, improving the trader’s decision-making and reducing the chances of emotional trading.
The rectangle chart pattern is effective for trading when traders are exploring markets with low to moderate volatility. Highly volatile markets increase the chances of false breakouts, which affects trading success and accuracy.
Online traders trade the rectangle pattern when they combine volume tools with other technical indicators to validate the rectangle’s signal. A surge in volume proves that the breakout is triggered by buying pressure and is likely to maintain. Technical indicators like oscillators show when an asset is overbought or oversold, confirming the market’s sentiment as price breakouts of resistance or support.
The trading strategies that work well with rectangle patterns are listed below.
- Breakout trading strategies: Traders open long positions when the price breaks above the resistance zone with a stop-loss below the support and take profit at the projected height of the rectangle from the breakout point. The traders open short positions when the price breaks below the support level, with a stop-loss above the resistance line and take-profit level at the projected height of the rectangle from the breakout point.
- Pullback trading: Traders look for long or short opportunities in the market correction when the price breakouts of the resistance or support zones and pulls back to the breakout point.
- Range trading: Traders buy at the support price level and sell at the resistance price level, exploiting the range-bound price action within the rectangle.
- Momentum trading: Traders use momentum indicators like the RSI, MACD, and ATR to identify strong momentum in the direction of the breakout and use them as confirmation to open trades.
- Channel trading: Traders draw a channel inside the rectangle pattern and buy and sell when the price touches the upper or lower channel line. Channel trading is ideal for short-term trading strategies such as scalping and day trading. It is commonly used in combination with other popular trading strategies to maximize short-term gains.
How often does a Rectangle Pattern occur?
The occurrence of rectangle patterns in trading varies depending on the timeframe, market or asset being traded, and market conditions. Rectangle patterns occur more frequently when traders define the pattern using two touches of the support and resistance line. A solid rectangle pattern that has been tested several times takes relatively longer to occur on a price chart.
Rectangle patterns occur frequently in shorter timeframes like the M1, M5, and M15, compared to longer timeframes like the daily, weekly, and monthly. Rectangle patterns formed on lower timeframes are less reliable because they are prone to false breakouts.
The rectangle pattern occurs more frequently on some assets than others. For instance, rectangle patterns appear on the major Forex currencies like EUR/USD and USD/JPY because they are liquid and experience consolidations often. Rectangle patterns appear fewer times on minor and exotic currency pairs like AUD/NZD or EUR/NOK because they are more volatile and rarely experience consolidation.
Rectangle patterns can appear in equities such as Apple Inc. (AAPL) and Microsoft Corporation (MSFT) when these shares enter periods of balanced supply and demand following significant corporate announcements or shifts in market sentiment. In such instances, the price fluctuates between well-defined support and resistance levels, thus forming a rectangle on the chart. These rectangles are more prominent in widely traded stocks, as increased liquidity fosters periodic consolidations where traders reassess market conditions before pushing prices in a new direction.
Cryptocurrencies like Bitcoin (BTC) and Ethereum (ETH) occasionally exhibit comparable patterns when heightened trading activity subsides and the market finds short-term equilibrium. Although digital assets are known for substantial volatility, there are intervals when the price stabilizes, creating a range that meets the criteria for a rectangle pattern. During these stretches, participants in the market observe the upper and lower boundaries formed by repeated touches, awaiting a decisive breakout to confirm whether the trend will resume or reverse.
Rectangle chart patterns for trading occur when the price enters a consolidation period because the supply and demand for an asset are at equilibrium. The rectangle shape forms when the price bounces between the support and resistance range formed, touching the lines at least twice.
Rectangle patterns are less common in markets experiencing high volatility, especially during news releases or geopolitical events, since price fluctuates rapidly.
The time it takes to form a rectangle pattern depends on the timeframe of analysis and market volatility. According to Thomas Bulkowski’s book “Encyclopedia of Chart Patterns’, the rectangle pattern takes around three months or 85 – 97 days to form on a daily timeframe. This time period reduces when analyzed in a shorter timeframe.
The rectangle pattern forms within minutes to hours on short timeframes like the 1-minute and 5-minute charts, but their accuracy is low due to market noise and false signals. The rectangle pattern takes time to form on longer timeframes and offers more reliable trading signals.
Rectangle patterns form faster in volatile markets due to the quick price but experience more false breakouts compared to less volatile markets, which take longer to form due to slow price movement.
The duration of rectangle patterns depends on various factors, including the duration of formation, the strength of the underlying trend, and the historical backtesting data lookback period. The duration period of the rectangle pattern differs on each timeframe and asset depending on the fundamental or sentimental factors affecting the markets.
Rectangle patterns last longer if they take a long time to form. Most traders experience a strong, sustained move after the breakout from rectangles that have been in consolidation for a long time. Rectangle patterns formed on higher timeframes, such as the daily and weekly, last longer than rectangles in intraday timeframes.
Rectangle patterns last longer if the preceding trend is weak, meaning buyers and sellers are still fighting for control. The supply and demand dynamics in strong trending markets usually mean that consolidations are short, causing the rectangle pattern to last a short time,
Traders who look at historical data when backtesting find varying results on how long the rectangle pattern forms. Traders take into account more historical data and find more accurate data on how long rectangle patterns last.
No, the rectangle pattern is not rare in trading. The rectangle pattern is a popular chart pattern in trading because it occurs in trending markets and is available across all markets and timeframes. Online traders observe the pattern across small timeframes, including the seconds, minutes, and hourly charts, meaning scalpers and intraday traders exploit it when taking positions.
The occurrence of the rectangle pattern becomes rare when trading it on higher timeframes, such as daily and weekly charts, where the pattern may take up to three months to form. Swing traders and position investors use the rectangle pattern on high timeframes because they do not need to place trades each trading day.
Rectangle patterns are rare in highly volatile markets because price movement is too drastic and is subject to manipulation, causing multiple false signals. Traders prefer trading the rectangle pattern on calm markets, which offer a higher success rate.
The success rate of the rectangle pattern ranges between 70 – 90%, according to Thomas Bulkowski’s book ‘Encyclopedia of Chart Patterns’. The exact success rate value of the rectangle pattern depends on the trader’s skill and experience, market conditions, and timeframe of formation.
Experienced traders experience a higher success rate with the rectangle pattern because they can identify high-quality rectangle patterns. Beginner traders often fall for false breakouts, leading to poor success rates with the pattern.
Traders experience a higher success rate trading the rectangle pattern in trending markets than in range-bound markets. The rectangle pattern occurs more frequently in trending markets, and the consolidation phases don’t last long, which means traders get entry opportunities quickly. Ranging markets experience numerous false signals, leading to a lower success rate in trading.
Rectangle patterns formed in higher timeframes result in a higher success rate for traders because the price movement is less noisy. The rectangle patterns formed on higher timeframes offer a more accurate representation of market sentiment, leading to better decision-making for traders and a better success rate.
Yes, the rectangle pattern in technical analysis is effective for intraday trading, swing trading, and other long-term trading strategies. The rectangle pattern represents supply and demand in the market accurately and has a high success rate when identifying potential continuation patterns, making it ideal for traders who require a reliable trading pattern.
Traders and investors look to rectangle patterns to understand when supply increases in the market due to selling pressure and when demand is high due to buying pressure. The rectangle pattern helps traders confirm their continuation signals by confirming that demand increases when the price breaks out to the upside, and supply increases when the price breaks to the downside.
Rectangle patterns provide clearly defined rules of trading with a success rate of around 70% in technical analysis, according to Thomas Bulkowski’s ‘Encyclopedia of Chart Patterns’, making them excellent options for traders looking to include consistency and discipline in their trading plans while deepening their understanding of the broader technical analysis definition.
The rectangle pattern in Forex trading is distinguished by its formation within highly liquid markets, shorter consolidation periods, and reliance on macroeconomic catalysts for breakouts. Unlike other markets, Forex rectangles often exhibit tighter price ranges due to the decentralized nature of currency trading and the influence of global liquidity pools.
Forex rectangles form when currency pairs oscillate between horizontal support and resistance levels during periods of market indecision, typically ahead of major economic data releases or central bank announcements. The pattern’s duration is often shorter compared to other markets, as the 24-hour trading cycle and high liquidity accelerate consolidation phases. Breakouts in Forex are more likely to align with the prevailing trend due to the Forex market sensitivity to macroeconomic factors, such as interest rate decisions or geopolitical events. Traders commonly set stop-loss orders just outside the rectangle’s boundaries and use the height of the pattern to project price targets—an essential technique when applying the Forex trading definition in technical analysis.
In stock trading, the rectangle pattern is characterized by longer consolidation phases, volume-dependent breakouts, and stronger alignment with institutional trading activity. Stock-specific news, such as earnings reports or regulatory approvals, often drives the pattern’s formation and resolution.
Stocks exhibit rectangles during periods of equilibrium between buyers and sellers, often lasting weeks or months, as seen in large-cap equities. The pattern’s validity hinges on volume trends: declining volume during consolidation and a surge during breakout signals institutional accumulation or distribution. Unlike Forex, false breakouts are less frequent in stocks due to stricter regulatory oversight and the prevalence of algorithmic trading, which enforces technical levels more rigidly. A valid breakout is usually confirmed by increased volume and a sustained close beyond the rectangle’s boundaries.
The rectangle pattern in crypto trading is marked by exaggerated volatility, rapid formation, and susceptibility to external market influences like regulatory news or whale activity. Crypto rectangles often form within hours or days, with breakouts frequently retesting support or resistance due to lower liquidity in altcoins compared to Bitcoin or Ethereum.
In crypto markets, rectangles emerge during consolidation after sharp price swings. Breakouts are less predictable due to the dominance of retail traders and the impact of social media sentiment. Volume confirmation is critical in distinguishing genuine breakouts from manipulation-driven moves, as whales and large traders can create false breakouts by placing and withdrawing large orders. Unlike in Forex and stocks, crypto traders often rely on on-chain metrics and funding rates in addition to technical indicators to validate rectangle breakouts.
What is an example of a Rectangle Pattern?
An example of a rectangle pattern in Forex trading was observed on the EUR/USD currency pair from July 2022 to January 2023. Throughout the second half of 2022, the EUR/USD pair traded within a defined range, bouncing between two key levels. The support level was around 1.0350, and the resistance level was approximately 1.0700. Over several months, the price consistently tested these levels, creating a rectangular consolidation pattern. This period of consolidation was marked by relatively stable price action, with the currency pair oscillating between these boundaries without making a decisive breakout in either direction.
The EUR/USD pair broke out of this rectangle pattern on January 5, when the price surged above the resistance level of 1.0700, signaling a potential bullish trend and completing the rectangle pattern.
The difference between a rectangle and head and shoulder pattern lies in the shape and impact on breakout direction. The rectangle pattern is a chart pattern where price action is bound by support and resistance levels, forming a rectangular shape. The head and shoulders pattern is a chart pattern that resembles a human head and shoulders because it forms three distinct peaks, with the middle peak being the highest, which forms the head.
The rectangle pattern is a neutral chart pattern, meaning it indicates both bullish and bearish trend directions. The head and shoulders pattern is a bearish reversal pattern, meaning that it indicates a gradual trend shift from an uptrend to a downtrend.
Traders use the rectangle pattern to open buy trades after a breakout above the resistance zone and execute sell trades when the price breakout below the support zone. Online traders open sell positions on the head and shoulders pattern once the price breaks the neckline of the right shoulder, indicating a complete reversal.
In which types of platforms can traders use rectangle chart patterns?
The types of platforms where traders can use Rectangle chart patterns are listed below.
- Forex trading platforms: Forex trading platforms like MetaTrader 4 and cTrader provide multi-timeframe charting with customizable horizontal support/resistance tools to visually identify formations during currency pair consolidation phases. Automated alert systems notify traders of potential breakouts, while integrated backtesting modules allow strategy optimization using historical volatility filters specific to Forex pairs like EUR/USD or GBP/JPY. Margin calculators and one-click order execution streamline risk management during breakout trades, a feature emphasized by Forex trading brokers for high-leverage environments.
- Stock trading platforms: Stock trading platforms such as Thinkorswim and Interactive Brokers deploy machine learning algorithms to detect formations in equities, factoring in volume profiles and sector correlation data. Institutional-grade tools enable comparative analysis of pattern reliability across market caps, with heatmaps highlighting accumulation/distribution signals during range-bound phases. Options analytics suites calculate probability cones for post-breakout price targets, particularly valuable for stock brokers managing multi-leg strategies in indices like SPX or single names experiencing earnings-related consolidation.
- Crypto trading platforms: Crypto exchanges like Bybit and Binance feature volatility-adjusted pattern recognition, crucial for assets with 24/7 trading cycles and asymmetric breakout risks. Integrated on-chain data overlays help distinguish organic consolidation from wash trading activity during pattern formation. Futures platforms combine liquidation heatmaps with pattern boundaries to identify high-probability breakout zones, while perpetual swap funding rate indicators assist crypto exchanges in filtering false breakouts common in altcoin markets. Multi-exchange depth charts enable confirmation of support/resistance levels across liquidity pools during rectangle development phases.
What are the Advantages of Rectangle Patterns?
The advantages of rectangle patterns are listed below.
- Clear support and resistance levels: The rectangle pattern clearly defines key support and resistance zones, minimizing the chances of subjectivity among traders.
- Visual clarity: The rectangle pattern is easy to identify due to the distinct shape with horizontal lines and price forming a rectangular shape.
- Versatility: Rectangle pattern is identifiable in all financial markets, across all time frames, from minute charts used by day traders to daily and weekly charts favored by swing traders and investors.
- Confirmation of market sentiment: The rectangle pattern reflects a period of indecision as buyers and sellers battle for control. Recognizing the rectangle pattern helps traders anticipate potential breakouts or reversals based on the market sentiment.
- Clear entry and exit points: The rectangle pattern provides a well-defined entry point at the break of the resistance and support levels and an exit point at the height of the rectangle.

What are the Limitations of the Rectangle Pattern?
The limitations of the rectangle patterns are listed below.
- False breakouts: The rectangle patterns experience false signals where the price breaks above the resistance level or below the support level, only to reverse and return to the previous range, leading to premature entry signals.
- Whipsaw price action: The rectangle patterns are unprofitable in whipsaw markets, where prices swing back and forth between support and resistance before eventually breaking out.
- Subjectivity: Traders find it hard to determine the exact boundaries of rectangle patterns, leading to different interpretations among traders.
- Limited profit potential: Rectangle pattern breakouts are sometimes small, limiting the profit potential for traders.
- Lack of directional bias: The rectangle patterns do not provide specific directional bias, and traders have to rely on the formation context to determine a bias, leading to losses for traders who get it wrong.
