A bear flag pattern is a bearish technical analysis formation that signals a potential continuation of a downward price movement. Bear flag patterns comprise sharp price declines (flagpoles) that are followed by consolidation periods (flags) in which prices move sideways or slightly upward. The consolidation is followed by a price breakout below the support level and a continued downward price movement.
The bear flag pattern, or bearish flag pattern, is a technical analysis pattern that occurs within a prevailing downtrend. A bear flag pattern works by indicating a potential continuation of a downtrend after a consolidation period.
There are eight steps to trade with the bear flag pattern. These steps are identifying the bear flag pattern, analyzing volume behavior, setting entry and stop-loss levels, determining profit targets, monitoring price actions, using additional indicators, monitoring market conditions, and formulating an exit strategy.
The trading strategies suitable for a bearish flag chart pattern include breakout trading, Fibonacci retracement for entries, divergence entry, and confirmation with reversal indicators, time frame alignment, and pullback entry.
The advantages of bear flag patterns include clear entry and exit points, efficiency in volatile markets, potential opportunities for multiple entries, integration with other technical analysis tools, strong volume confirmations, indication of continuation, and versatility across different timeframes.
The disadvantages of bear flag patterns include the risk of short squeeze, false breakouts, volume misinterpretation, limited profit potential, risk of overtrading, and ignoring other signals.
What is a Bear Flag Pattern?
A Bear flag pattern is a bearish technical analysis formation that indicates a potential continuation of a downtrend. Bear flag patterns consist of sharp price declines (flagpoles) that are followed by consolidation periods (flags) in which prices move sideways or slightly upward. Price breaking below the flag’s support signals further bearish momentum.
The bear flag pattern is a bearish formation in technical analysis that indicates that a prevailing downtrend in the market is likely to continue. Bear flag patterns are significant for traders who want to capitalize on an existing bearish trend since the pattern suggests that the prices will probably keep falling after the consolidation phase.
A bear flag pattern starts forming with a sharp price decline that is commonly referred to as the flagpole. The initial price drop is characterized by strong selling pressure that is triggered by market sentiment or negative news. The steepness of the price drop reflects the urgency and intensity of selling and leads to a notable decrease in the asset’s price within a short period. The flagpole serves as a visual representation of the prevailing bearish sentiment in the market and helps establish a context for the subsequent consolidation phase.
A bear flag pattern features a consolidation phase that forms the flag portion of the pattern. Prices move sideways or may experience slight upward movements with reduced volumes during the consolidation. Consolidation phases may last from several days to weeks and indicate temporary pauses in selling activity. Traders interpret a consolidation phase as indecision among market participants. Some traders may start taking profits while other traders wait for clearer signals before opening additional short positions. The price action within the flag of a bear flag pattern takes various forms, such as a parallel channel or a slight upward slope, but does not break significantly above the flagpole’s recent high.
The bear flag pattern is confirmed by a price break below the lower boundary of the flag. The lower boundary of the consolidation phase is the support level in a bear flag pattern. A price breakout is a sign of renewed bearish momentum and suggests that sellers are regaining control over the market. Traders look for increased volume accompanying the price breakout to confirm the validity of the pattern. A break below the support level triggers short-selling activity since traders anticipate further declines in price. The confirmation of a bear flag pattern leads to significant downward price movements that reinforce the bearish outlook established by the initial flagpole.

The importance of the bear flag pattern in trading is to offer trend continuation signals, strategic entry and exit points, efficient risk management tactics, and market sentiment insights.
The bear flag pattern offers a clear signal of a trend continuation within a prevailing downtrend. A bear flag pattern appears after a sharp price decline that suggests that the market is not reversing but rather consolidating before continuing with the downward movement. Identifying the bear flag pattern allows traders to align their trading strategies with the prevailing bearish sentiment to increase the odds of successful trades. Traders are able to anticipate market behavior and position themselves effectively to capitalize on expected declines by recognizing the bear flag pattern.
A bear flag pattern allows traders to identify precise entry points for short positions. Traders wait for a definitive break below the flag’s support level to confirm the pattern. The strategic entry point maximizes the potential for profits since the price breakout indicates a resumption of the downtrend. The bear flag pattern helps traders determine exit points by suggesting where to take profits or implement stop-loss orders. Strategic entry and exit points on a bear flag pattern enhance overall trading efficiency and help minimize emotional decision-making.
The bear flag pattern aids in effective risk management by helping traders identify the flag structure. Placing stop-loss orders above the pattern provides traders with a clear risk threshold. Managing risks with stop-loss orders protects traders from significant losses in case the market moves against their position.
A bear flag pattern provides valuable insights into market psychology. The pattern illustrates the dynamics between buyers and sellers. The initial sharp decline represents strong selling pressure, while the subsequent consolidation indicates a temporary pause where buyers attempt to step in. The indecision phase reveals market sentiment and provides traders with a deeper understanding of potential market movements, which can be especially useful once they have a solid grasp of the definition of trading.
The bear flag chart pattern is not suitable for all trading approaches. The bear flag patterns perform optimally in day trading, technical trading, and scalping strategies where rapid price movements and precise timing create profitable opportunities. The bearish continuation flag pattern excels when traders capitalize on short-term momentum shifts.
Day trading benefits from bear flag formations because the pattern completes within hours to match intraday timeframe requirements that active traders prefer. Technical trading strategies leverage bear flag patterns since the formation provides clear entry and exit signals based on price action and volume confirmation that technical analysts require for decision-making.
Scalping operations find bear flag patterns particularly valuable because the quick breakdowns from flag formations generate small, rapid price movements that scalpers target for frequent profits. The bear flag chart pattern’s tendency to produce swift directional moves aligns perfectly with scalping’s requirement for immediate price action.
Conversely, the bear flag pattern performs poorly in position trading and fundamental trading approaches. Position traders seeking long-term holdings find the bear flag pattern’s short duration incompatible with their extended timeframes, while fundamental traders focusing on company valuations discover that bear flag signals often contradict underlying fundamental analysis and create conflicting trade signals that undermine strategy coherence, especially when compared to other types of trading that align better with technical indicators.
How Does the Bear Flag Pattern Work?
The bear flag pattern is a technical analysis pattern that typically occurs within a prevailing downtrend. A bear flag pattern works by indicating a potential continuation of a downtrend after a consolidation period.
The flagpole of a bear flag pattern shows a sharp price decline. The significant price drop reflects strong selling pressure and bearish sentiment in the market. The price action during the initial downtrend is characterized by high trading volume, indicating that many traders are actively selling. High trading volumes reinforce the prevailing downtrend. A steep flagpole signifies strong conviction among sellers.
The price enters a consolidation phase after the price declines and forms the flag. Prices move sideways or may drift slightly upward during the consolidation. The price consolidation works as a sign of a temporary pause in the selling activity as the market absorbs the previous decline. The price action in the flag phase displays lower market volatility, characterized by reduced trading volumes compared to the flagpole. The reduced trading activities during the formation of a bear flag pattern suggest indecision among traders, since some buyers are attempting to step in, but the overall market sentiment remains bearish.
High trading volumes serve as indicators of strong selling pressure in the initial downtrend of a bear flag chart pattern. Trading volumes decrease as the price consolidates within the flag. The reduction in trading volumes reflects a lack of conviction in the brief upward movement. A significant surge in trading volumes is experienced after the breakout below the flag’s support. Increased trading volumes validate the bear flag pattern as a bearish signal and suggest that sellers are re-entering the market with renewed strength.
The confirmation of the bear flag pattern occurs when the price breaks below the support level established during the consolidation phase. The breakout signals that sellers have regained control and are likely to push prices lower. Traders look for a decisive break below the flag’s support line and increased trading volume to confirm the continuation of the downtrend. A combination of price action and volume strengthens the reliability of the bear flag signal.
How to Trade with Bear Flag Pattern?
There are eight steps to trade with the bear flag pattern. The steps are identifying the bear flag pattern, analyzing volume behavior, setting entry and stop-loss levels, determining profit targets, monitoring price actions, using additional indicators, monitoring market conditions, and formulating an exit strategy.
The different steps to trade bear with bear flag pattern are listed below.
- Identify the Pattern. Identifying the bear flag pattern involves spotting the pattern on your trading charts. Online traders look for the two distinct phases that characterize the bear flag pattern, the flagpole and the flag. The flagpole represents a strong price decline, indicates robust selling pressure, and highlights a clear bearish sentiment. The price decline is steep and is accompanied by high volumes that showcase sellers’ dominance over the market. Price enters a consolidation phase following a flagpole and moves sideways or slightly upward to form the flag. Price consolidation on a bear flag pattern indicates that the market is absorbing the recent decline and may lead to further selling.
- Analyze Volume Behavior. Analyzing volume behavior helps confirm the bear flag pattern. High trading volume indicates strong selling interest during the flagpole and helps Forex, stock, cryptocurrency and commodity traders validate the bearish trend. Volume tapers off as the price consolidates within the flag. Price consolidation and reduced volume reflect a temporary lull in selling activity and buyer indecision. A significant increase in volume upon breaking below the flag’s support helps online traders confirm the bear flag pattern and the likelihood of a continued downtrend.
- Set Entry and Stop-Loss Levels. Determining your entry and stop-loss levels is crucial once you have identified and confirmed the bear flag pattern. Forex, stock, cryptocurrency and commodity traders open a short position just below the support level of the flag. The support level signals a breakout and increases the trader’s chances of capturing the downtrend. Day traders set stop-loss orders just above the resistance level of the flag to protect their capital in case of a false breakout and allow for effective risk management.
- Determine Profit Targets. Establishing profit targets on the bear flag pattern is essential for successful trade management. Traders measure the height of the flagpole, which is the distance from the highest point of the flagpole to the lowest point. They subtract the measured height from the breakout point to set a potential profit target. The projection provides a reasonable expectation of how far the price may move after the breakout. Forex, stock, cryptocurrency and commodity traders consider key support levels or recent lows of the bear flag pattern that may act as potential exit or take-profit points.
- Monitor Price Actions. Checking price actions after entering a trade based on the bear flag pattern involves confirming the continuation of the downtrend, observing candlestick patterns, watching for retracements, and analyzing volume. Day traders look for downtrend confirmation as the price continues to create lower highs and lower lows. Traders set alerts for key levels, adjust their stop-losses, and recognize exit signals as effective price action monitoring components.
- Use Additional Indicators. Incorporating technical indicators together with the bear flag pattern enables traders to enhance their trading strategies. Market indicators, such as moving averages, allow traders to gauge the overall trend direction. A price below the moving averages signals a bearish market. Forex, stock, cryptocurrency and commodity traders may monitor the RSI (Relative Strength Index) for overbought or oversold conditions. An RSI above 70 suggests a pullback, while below 30 indicates oversold conditions. Online traders employ the MACD (Moving Average Convergence Divergence) crossovers or divergence signals for further confirmation of bearish momentum in financial markets.
- Monitor Market Conditions. Observing market conditions when using the bear flag pattern involves staying informed about economic news and events, which is vital in Forex, stock, cryptocurrency and commodity trading. Online traders monitor key economic indicators, such as employment reports, GDP, and inflation data since the indicators influence price movements. Online traders stay aware of geopolitical developments that may impact market sentiment and volatility. Traders keep track of central bank policies and interest rate decisions that may lead to significant price movements.
- Formulate an Exit Strategy. Managing trades after opening positions based on bear flag pattern signals requires a clear exit strategy. Traders establish clear criteria for exiting trades that may include reaching predefined profit targets or achieving a specific risk-reward ratio, such as a 2:1 or 3:1 ratio. Trailing stops help day traders lock in profits as the price moves in their favor and allow them to capture more gains while still protecting against reversals. Traders review their trades and market conditions regularly and adjust their exit strategies based on changing market dynamics or emerging patterns.
Traders utilize the bear flag chart pattern for its ability to signal trend continuation within a prevailing downtrend, confirm market sentiments, indicate temporary exhaustion, and facilitate short selling.
Traders recognize that the market is biased toward selling once they identify a bear flag pattern. The initial decline (the flagpole) shows strong bearish activity, while the subsequent consolidation phase (the flag) suggests that sellers are not done yet. The bear flag pattern’s alignment with bearish sentiment allows traders to confidently place short trades and remain confident that they are following a dominant market downtrend.
Traders use the bear flag pattern because of the pattern’s indication of temporary exhaustion. The temporary exhaustion on a bear flag pattern enables traders to enter the market before the next leg down and capitalize on the expected continuation of the downtrend. The formation of a bear flag indicates a temporary pause in the downtrend and is characterized by a period of consolidation. The consolidation phase signifies that the aggressive selling that led to the flagpole may have momentarily slowed.
Traders use the bear flag pattern because of the pattern’s potential opportunities for short selling. The bear flag pattern allows traders to identify entry points that maximize profit potential while minimizing risk. Traders initiate short positions with a clear rationale rooted in the expectation of continued downward movement as prices break below the flag’s support level. The specialized focus on short selling makes the bear flag pattern an invaluable technical analysis tool for traders who specialize in bearish trading strategies.
Identifying the bear flag pattern involves looking for explicit formation features, such as the flagpole, consolidation, support level, price breakout, and trend continuation. Traders monitor the shifts in volume during different formation phases to enhance the accuracy of recognizing the bear flag pattern.
Flagpole formation is the first element of the bear flag pattern. The flagpole represents a sharp decline in price that indicates strong selling pressure and a clear downtrend. Traders look for a steep and rapid drop in price that sets the stage for the pattern. High trading volume accompanies the initial price decline and confirms that there is a significant number of sellers active in the market.
The consolidation phase (Flag) follows the formation of the flagpole and is characterized by sideways or slightly upward price movement. The price forms a rectangular shape or a downward-sloping channel that indicates indecision among traders during the consolidation. Price consolidation shows that sellers have paused their aggressive selling, the bearish sentiment remains intact, and the market is preparing for a potential continuation of the downtrend. Trading volumes reduce significantly during the consolidation phase. Low volumes signify reduced market action by the sellers and entry attempts from the buyers.
Support and resistance levels are essential for identifying the bear flag pattern. The support level is the lower boundary of the flag, where the price tends to find support before potentially breaking down. The resistance level is the upper boundary of the flag, where selling pressure usually emerges. Support and resistance levels provide traders with clear reference points for entering short positions. For instance, price breaking out below the support level indicates a stronger likelihood of a bearish continuation.
Breakout confirmation helps traders validate the bear flag pattern. A valid bear flag is confirmed when the price breaks below the established support level of the flag. Price breakouts signal a continuation of the downtrend. A breakout should occur with increased trading volume to be considered reliable. A surge in volume during the breakout indicates that sellers are re-entering the market with conviction.
The continuation of the downtrend follows a price breakout below the support level. The price should continue to decline following the confirmation of the bear flag pattern. Traders look for lower highs and lower lows to reinforce the bearish trend. The price movement mirrors the height of the flagpole from the breakout point and provides a target for potential profits.
Timeframe consideration is important in identifying the bear flag pattern. The bear flag pattern appears across various timeframes. Bear flag patterns on higher timeframes, such as daily or weekly charts, are more reliable than bear flag patterns on lower timeframes, like 15-minute or hourly charts. Traders should ensure that the overall market sentiment aligns with a bearish outlook. The effectiveness of the bear flag pattern increases when it occurs within the context of a broader downtrend.
An example of a Bear Flag Pattern is shown below.

The success rate of the bear flag pattern is about 65% to 75% when the pattern forms in a strong downtrend and is confirmed by increased trading volumes after a breakout. The success rate of the bear flag pattern varies according to different factors, such as market conditions, volume dynamics, and timeframes.
Market conditions significantly affect the success rate of the bear flag pattern. Bear flag patterns perform better in clearly defined bearish markets. The likelihood of a bear flag pattern leading to further declines increases when the overall market sentiment is negative. Bear flag patterns forming in strong downtrends may have success rates as high as 70%, according to Thomas Bulkowski’s Encyclopedia of Chart Patterns. The success rate of the bear flag pattern drops to around 50% if the market is experiencing mixed or bullish sentiment.
Volume dynamics play a critical role in validating the breakout from the bear flag pattern. Bulkowski notes that breakouts supported by increased volume enhance the success rate of the bear flag pattern to about 75%. Price breakouts with low trading volumes indicate a weakened follow-through that reduces the bear flag pattern’s success rate to around 55%.
The timeframe within which the bear flag pattern appears affects the pattern’s reliability. Patterns on higher timeframes, such as the daily and weekly patterns, have success rates of 65-70%, according to Bulkowski’s reports. Bear flag patterns on lower timeframes, such as 15-minute or hourly charts, may attain success rates as low as 50-55%. The differences in the success rates of the bear flag pattern across different timeframes underscore the importance of selecting appropriate timeframes for analysis.
Yes, the bear flag in technical analysis is an effective pattern. Traders rely on the bear flag pattern because of the pattern’s role as a continuation signal in bear markets, clear formation structure, and high success rates.
The bear flag pattern in technical analysis occurs during established downtrends and signals that the prevailing bearish momentum is likely to continue. The bear flag pattern’s alignment with the overall market direction increases the chances of successful trades. A bear flag pattern forming after a significant price drop reinforces the idea that sellers are still in control and makes it more likely that the price will resume a downward trajectory.
The bear flag pattern consists of two main parts: the flagpole, which is a sharp and rapid decline in price, followed by a consolidation phase where the price moves sideways or slightly upward. The clear structure helps traders identify the pattern quickly and allows for timely decision-making. Traders set specific entry and exit points based on the established support and resistance levels of the flag.
The bear flag pattern in technical analysis has a success rate of about 65% when the pattern forms in a strong downtrend, according to Thomas Bulkowski’s Encyclopedia of Chart Patterns. The statistic suggests that the price continues to decline after the breakout from the flag a significant majority of the time. For traders who want to understand broader market behavior and predictive chart formations, exploring what is technical analysis provides essential context. The success rate of the bear flag pattern, and the flag pattern in general, indicates that traders may rely on this pattern for potential profit.
In Forex trading, the bear flag pattern manifests with distinct characteristics shaped by high liquidity, macroeconomic influences, and institutional participation. Compared to other markets, Forex bear flags often exhibit tighter consolidation phases and shorter timeframes, typically forming on hourly or 4-hour charts due to the market’s 24-hour nature. The reliability of breakouts is heightened by the depth of liquidity, reducing false signals.
The Forex bear flag’s structure adapts to currency pairs’ sensitivity to interest rates, geopolitical events, and economic data releases. For instance, during periods of central bank policy shifts, the flagpole may form rapidly as algorithmic traders amplify momentum, while the consolidation phase reflects temporary equilibrium between buyers and sellers. The descending trendlines of the flag often align with key Fibonacci retracement levels (e.g., 38.2% or 50%), acting as dynamic resistance. Volume analysis is less emphasized in Forex trading than in equities, as spot Forex lacks centralized exchange data, but traders rely on price action and momentum oscillators like the Relative Strength Index (RSI) to confirm breakouts.
In stock trading, the bear flag pattern integrates company-specific fundamentals, earnings cycles, and sector-wide trends, leading to prolonged consolidation phases and volume-dependent validations. Unlike Forex, stock-based bear flags often span days to weeks, with breakout accuracy heavily influenced by trading volume and institutional positioning.
The flagpole in equities frequently correlates with negative earnings surprises or regulatory actions, while the consolidation phase reflects retail investor indecision or short-covering rallies. For example, a biotech stock crashing 20% on failed clinical trials (flagpole) might consolidate within a 5% range for two weeks as speculative buyers temporarily stabilize prices. Volume typically dwindles during consolidation, then surges on the breakout, confirming bearish momentum. Additionally, stock patterns are more prone to false breakouts due to unscheduled news, such as merger announcements or analyst upgrades, which can abruptly reverse trends.
In crypto trading, the bear flag pattern is distinguished by accelerated formation times, heightened volatility, and susceptibility to retail-driven sentiment shifts. Crypto bear flags often consolidate within hours or days, with breakouts exhibiting exaggerated price movements due to lower market depth and leverage-induced liquidations.
The flagpole in cryptocurrencies typically stems from macroeconomic triggers (e.g., Fed rate hikes) or protocol-level issues (e.g., Ethereum network congestion), while the flag phase reflects speculative buying or profit-taking. For instance, Bitcoin might drop 12% amid a broader market sell-off (flagpole), then stabilize in a 3% range for 48 hours as derivatives traders adjust positions. Unlike Forex or stocks, crypto flags frequently violate traditional Fibonacci levels, with breakouts targeting psychological price zones (e.g., round numbers like $30,000 for BTC). The 24/7 market cycle also means patterns form unpredictably, often overnight or during low-liquidity periods.
What Trading Strategies are Suitable for Bear Flag Patterns?
The “Trading Strategies” suitable for bear flag patterns are listed below.
- Breakout Trading: Breakout entry when trading a bear flag pattern involves opening a short position when the price breaks below the lower trendline of the bear flag pattern. The price breakout signals a continuation of the prevailing downtrend and makes it a critical point for traders to enter the market. Traders should wait for a close below the lower trendline to confirm the breakout. A significant increase in trading volume during this breakout enhances the validity of the breakout and indicates strong selling pressure. Traders should act quickly once the breakout on the bear flag pattern is confirmed since the price may begin to decline rapidly.
- Fibonacci Retracement for Entries: Fibonacci retracement for entries when trading a bear flag pattern involves applying Fibonacci retracement levels to the subsequent pullback. Fibonacci retracement levels help traders identify potential resistance points where the price may reverse during a retracement. For example, prices retracing to the 61.8% Fibonacci level may provide a good opportunity to enter a short position. Fibonacci retracement for entries strategy helps traders pinpoint entry points on the bear flag pattern based on technical analysis.
- Divergence Entry: Divergence entry when trading a bear flag pattern involves identifying a bearish divergence between the price action and momentum indicators, such as the RSI or MACD. A bearish divergence occurs when the price makes higher highs while the indicator fails to do the same, which suggests weakening momentum. The bearish divergence serves as a signal that the price may soon reverse downward. Traders should watch for bearish divergence as the price approaches the breakout point when trading the bear flag pattern because the divergence adds another layer of confirmation for entering a short position.
- Confirmation with Reversal Indicators: Confirmation with reversal technical indicators when trading a bear flag pattern involves identifying potential reversal points as the price nears the breakout level. There is a likelihood of a downward price movement when the RSI indicates overbought conditions or when the MACD shows a bearish crossover. Incorporating reversal indicators into the bear flag strategy provides additional confirmation for entering short positions and helps traders make more informed decisions.
- Time Frame Alignment: Time Frame alignment when trading a bear flag pattern involves confirming the bear flag pattern across multiple timeframes. A trader identifying a bear flag pattern on a 15-minute chart should consider checking higher time frames, like hourly or daily charts to ensure that the overall trend is bearish. A multi-time frame analysis helps traders avoid counter-trend trades and strengthens the conviction behind their short positions. Aligning trades with the broader trend when trading a bear flag pattern increases the likelihood of a successful outcome.
- Pullback Entry: Pullback entry when trading bear flag patterns involves waiting for price retracements to the upper trendline or a nearby resistance level after a breakout from the bear flag. The price pullback provides a favorable entry point for traders looking to short the asset at a higher price before the downtrend resumes. Traders improve their risk-reward ratio by entering during this retracement since they are able to place tighter stop-loss orders above the resistance, which is a common feature in many trading strategies designed to capitalize on short-term reversals. Pullback entry requires patience. Traders must wait for the price to show signs of weakness upon reaching the upper trendline of the bear flag pattern.
Yes, the bear flag pattern is risky. Traders may manage and mitigate risks associated with bear flag patterns by using stop-loss orders, confirming breakouts, incorporating additional indicators, and practicing disciplined trading.
Placing stop-loss orders above the upper trendline of the bear flag or above a recent swing high helps limit potential losses. Stop-loss orders are automatic exit strategies that ensure losses are contained if the price moves against open short positions.
Traders should wait for confirmation of the breakout before opening a short trade. Traders need to look for a close below the lower trendline accompanied by increased volume. Breakout confirmation reduces the likelihood of false breakouts and strengthens the trader’s bear flag signal.
Incorporating additional technical indicators, such as the RSI or MACD, further confirms the bearish momentum. Traders should look for bearish divergence or overbought signals as extra validation before entering a short position.
Traders must stick to their trading plans and avoid emotional decision-making. Traders need to establish clear criteria for entering and exiting trades using the bear flag pattern and remain disciplined to follow the trading strategy in the face of market fluctuations.
The differences between a bear flag and a bull flag pattern are different market sentiments, price actions, trend directions, and formation shapes. The “bull flag vs bear flag” patterns have various differences despite being continuation signals.
The bear flag pattern reflects a bearish sentiment in the market and signals that traders expect prices to continue declining after a brief period of consolidation. The bull flag pattern indicates a bullish sentiment in which traders anticipate that prices will rise further following a consolidation phase.
A bear flag forms after a significant price decline that leads to a consolidation period, which resembles a rectangular or downward-sloping channel. The sharp price drop preceding a bear flag pattern is followed by a sideways or slight upward price move. The price consolidation suggests that the selling pressure is temporarily exhausting before a potential continuation of the downtrend. A bull flag pattern forms after a significant price increase that leads to a consolidation phase. The consolidation indicates a pause in buying before the uptrend resumes.
The bear flag is characterized by a downward-sloping channel or a rectangle that tilts downwards. Prices oscillate within the consolidation range and gradually lose momentum prior to a downward breakout. The bull flag is characterized by an upward-sloping channel or a rectangle that tilts upwards. Prices on the bull flag pattern consolidate and show signs of weakening before breaking out with a strong upward movement.
In which types of platforms can traders use bear flag chart patterns?
The types of platforms where traders can use bear flag chart patterns are listed below.
- Forex trading platforms: Forex trading platforms integrate advanced charting tools like those offered by FXStreet, providing real-time interbank rate visualizations and over 70 technical indicators such as linear regression and ADX to identify bear flag formations. These systems enable multi-timeframe analysis, allowing traders to validate consolidation phases against macroeconomic data feeds. Automated alert systems notify users when price action breaches predefined flag boundaries, while volatility metrics help assess pattern reliability. Platforms often include backtesting environments to simulate bear flag strategies across currency pairs, with execution APIs enabling rapid short positioning through Forex trading brokers embedded within the interface.
- Stock trading platforms: Stock trading platforms like StockCharts.com deploy pattern recognition engines that scan equities for bear flag formations across custom intervals. These systems overlay volume profiles and sector-specific moving averages to confirm breakdown probabilities, integrating fundamental data to assess pattern validity during earnings cycles. Correlation analysis tools help traders compare flag patterns with short interest metrics, while institutional order flow indicators reveal dark pool activity near key levels. Some advanced platforms offer volatility forecasts to time entries, along with risk checks that stock brokers use to manage position sizing during major breakdowns.
- Crypto trading platforms: Crypto exchanges such as Kraken and OKX implement machine learning-based charting systems that adapt bear flag detection to cryptocurrency’s high volatility, incorporating on-chain liquidity data and futures open interest into pattern analysis. Multi-exchange aggregation helps normalize price discrepancies during flag consolidations, while social sentiment indicators from tools like LunarCrush assess retail trader bias. Platforms also use fractal dimension indicators to filter out market noise, with margin calculators automating risk allocation for breakdown trades. Real-time VWAP bands and whale alert integrations help confirm pattern breakdowns, a feature leveraged by crypto exchanges to support high-frequency short strategies.
What are the Advantages of Bear Flag Patterns?
The advantages of bear flag patterns are listed below.
- Clear Entry and Exit Points: Bear flag patterns provide clear levels for entry and exit. The breakout below the lower trendline serves as a clear signal to enter a short position. Traders set profit targets based on the height of the flagpole and project the distance downward from the breakout point to establish a strategic exit point. Clear entry and exit points help traders plan their trades more effectively and reduce ambiguity about when to enter or leave the market.
- Efficiency in Volatile Markets: Bear flag patterns emerging in volatile markets offer quick and actionable trading opportunities. The rapid price movements associated with bear flag patterns enable traders to capitalize on short-term price fluctuations. Recognizing bear flag patterns in volatile markets leads to timely entries and exits that maximize potential gains.
- Opportunities for Multiple Entries: Bear flag patterns allow for various entry points. Traders wait for pullbacks to the upper trendline or resistance levels after the initial breakout to enter new short positions. The pullback entry strategy enhances the average entry price and allows traders to compound their potential profits in a trending market when trading a bear flag pattern.
- Integration with Other Technical Analysis Tools: Bear flag patterns may be combined with other technical analysis tools and indicators. Momentum indicators, like RSI or MACD, provide additional confirmation of bearish momentum. Fibonacci retracement levels help traders identify potential resistance points during pullbacks. Traders create a robust trading strategy that enhances their decision-making process by using multiple analysis techniques with the bear flag pattern.
- Strong Volume Confirmation: A breakout from a bear flag pattern occurs with increased trading volume that indicates strong selling pressure. The surge in trading volume serves as validation of the breakout and reduces the likelihood of false signals. Traders feel more confident using the bear flag pattern to enter a short position after seeing a significant increase in volume accompanying the price movement.
- Indication of Continuation: The bear flag pattern suggests that the prevailing downtrend is likely to persist after a period of consolidation. The continuation signal gives traders confidence since they are trading in the direction of the dominant market trend. Understanding the behavior of the bear flag pattern enhances the trader’s decision-making process and allows them to align their strategies with market momentum.
- Versatility Across Time Frames: Bear flag patterns are observed across various time frames, from minutes to hours and days. The pattern’s versatility allows traders to adapt their strategies to fit their trading style and time commitment. A bear flag pattern that forms on a longer time frame may indicate a more significant trend, while patterns on shorter time frames may offer quick trading opportunities.

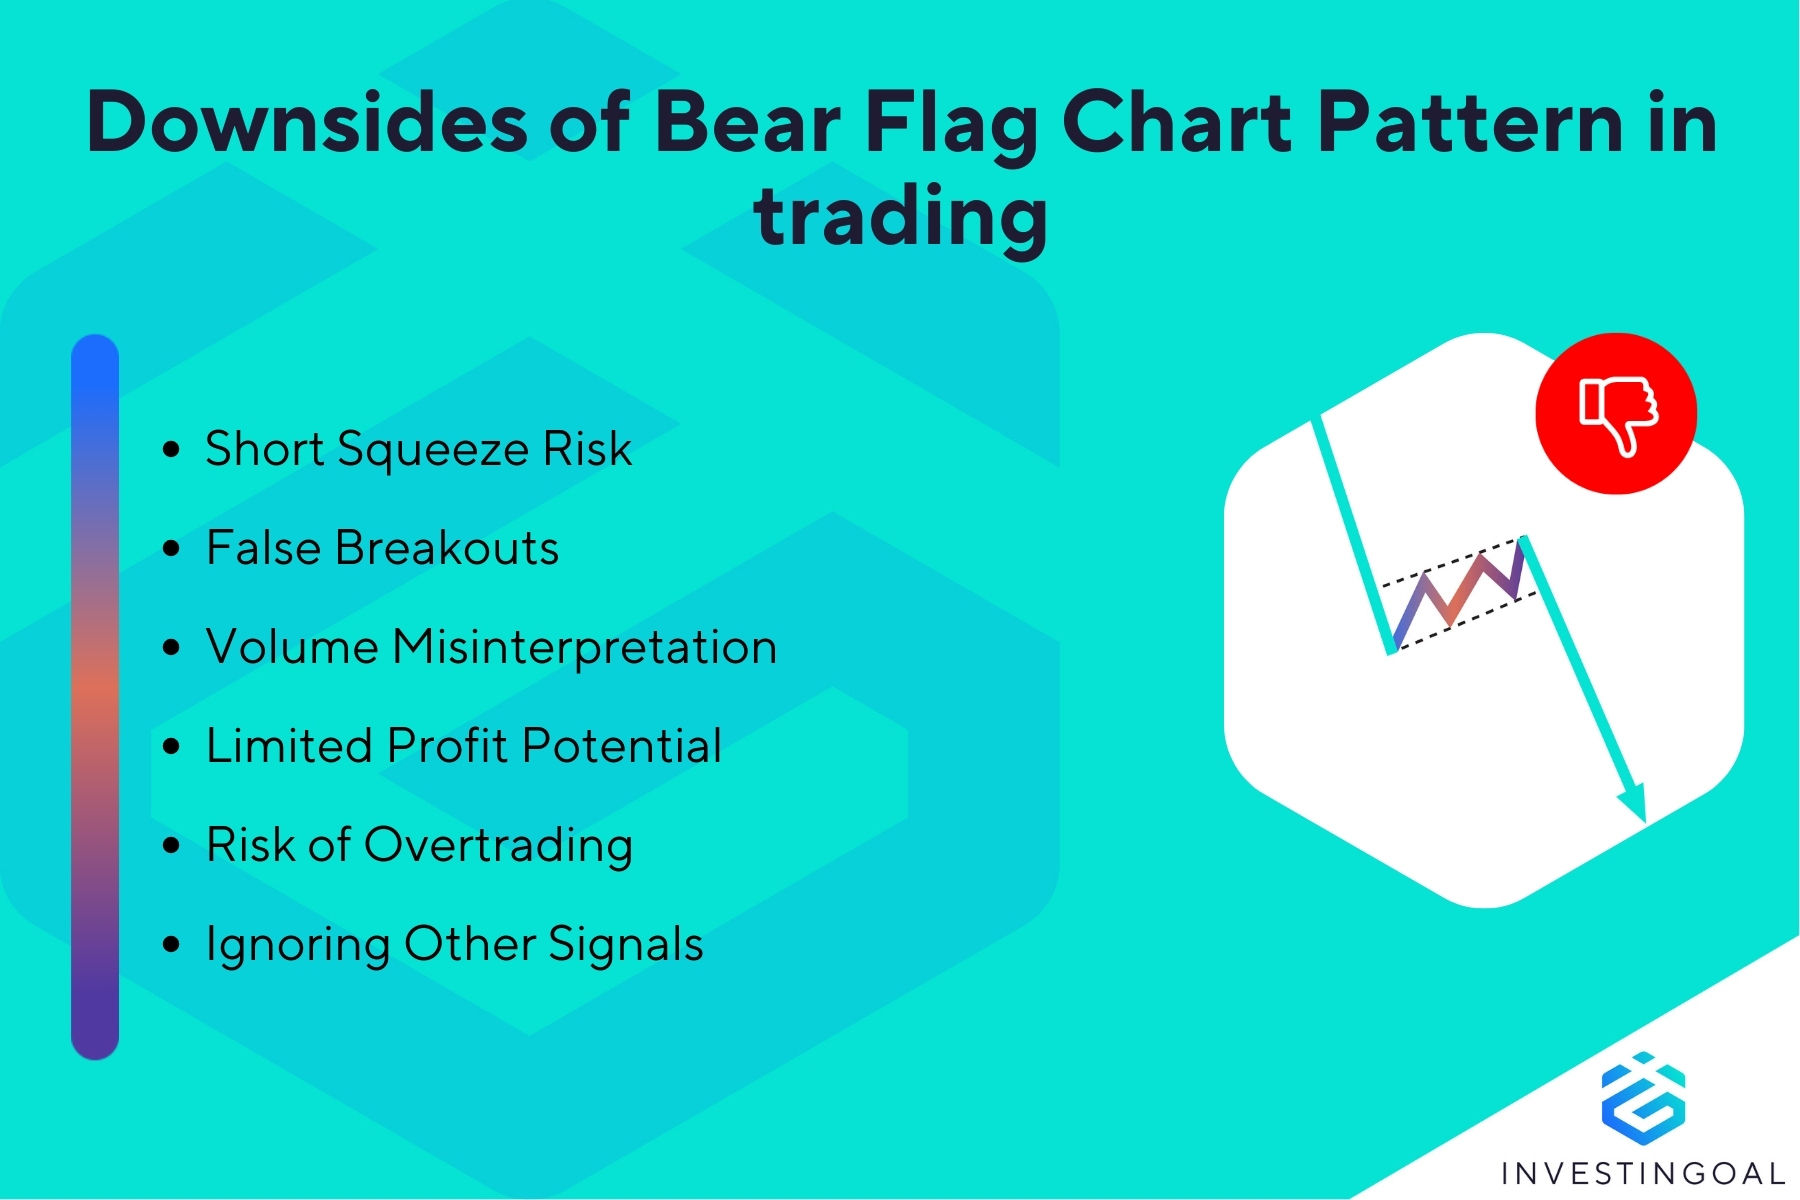
What are the Disadvantages of Bear Flag Patterns?
The disadvantages of bear flag patterns are listed below.
- Short Squeeze Risk: A short squeeze when trading a bear flag pattern occurs when short sellers rush to cover their positions to limit losses and end up driving the price up rapidly. Traders may trigger a short squeeze if there are many short positions opened simultaneously to capitalize on a bear flag pattern. The sudden buying pressure leads to significant losses for those who entered short positions based on the flag pattern. Traders should be cautious and consider potential reversal signals or broader market trends before entering a short trade based on a bear flag signal.
- False Breakouts: Bear flag patterns have a significant risk of occurrence of false breakouts. A false breakout happens when the price dips below the lower trendline but then quickly reverses direction and moves back into the range of the flag. False breakouts catch traders off guard and lead to losses for those who enter short positions based on the initial breakout signal. Traders need to be vigilant and consider using the bear flag pattern with additional confirmation signals, such as candlestick patterns or volume analysis to differentiate between a genuine breakout and a false one.
- Volume Misinterpretation: An increase in volume during a breakout on a bear flag pattern is seen as confirmation but may sometimes be misleading. A sudden spike in volume may be due to panic selling, which may fail to sustain the downtrend. The price may reverse soon after the breakout and lead to substantial losses for traders. Traders need to confirm the bear flag pattern’s volume trends with other technical indicators or patterns to avoid being misled.
- Limited Profit Potential: Bear flag patterns may sometimes have a limited profit potential despite signaling strong downward price movements. The price may decline a short distance before consolidating or reversing after a breakout. Traders may find it challenging to achieve their profit targets if the price does not move significantly in their favor. The reduced price decline leads to underwhelming returns on open trades. Setting realistic profit expectations based on historical price movements and the performance of the bear flag pattern helps traders mitigate the problem of limited profit potential.
- Risk of Overtrading: Bear flag patterns may tempt some traders to overtrade and seek too many setups within a short time frame. Overtrading results in taking unnecessary risks or deviating from a well-defined trading plan. Overtrading leads to increased transaction costs and may erode capital through a series of small losses. Traders should establish strict criteria for entering and exiting trades when trading the bear flag pattern and adhere to the trading strategy.
- Ignoring Other Signals: Bear flag patterns may lead some traders to overlook other important technical analysis signals. A narrow analytical approach may cause traders to miss broader market trends or fail to recognize other significant patterns that may impact their trades. A comprehensive analysis incorporating multiple signals and indicators with bear flag patterns enhances decision-making and improves trading outcomes.